1. At a Glance
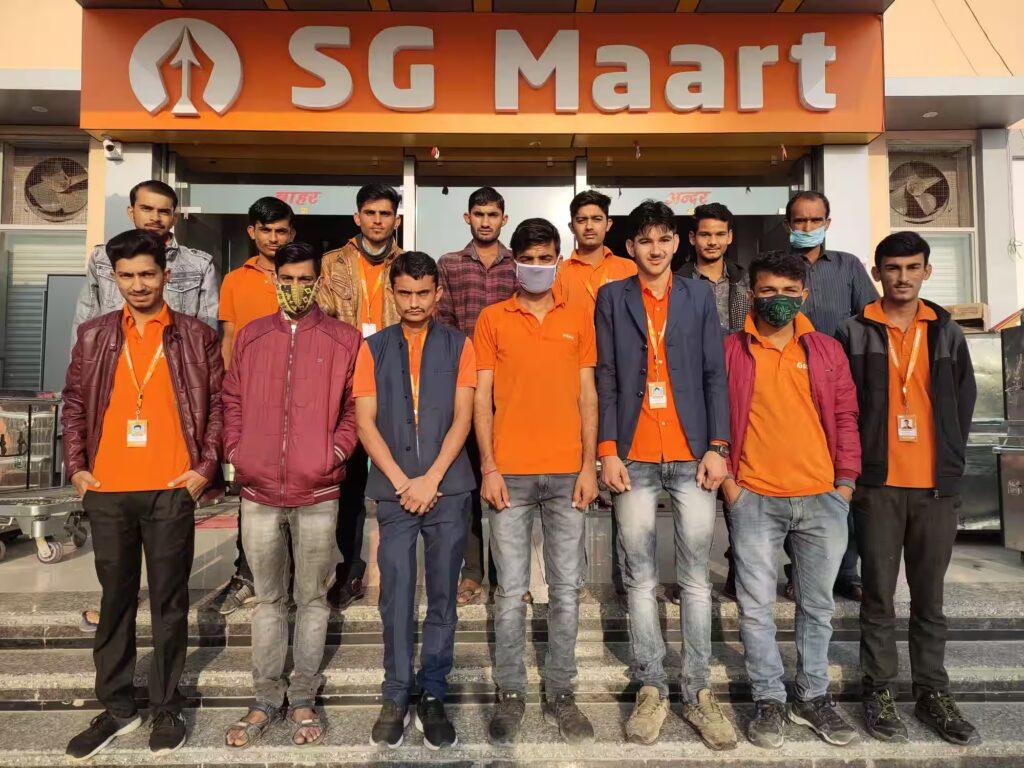
SG Mart went from near-zero revenue to ₹5,500 Cr TTM sales in under two years. Thanks to a Gupta-powered open offer and a ₹266 Cr solar order, the “steel bazaar” has now entered the renewables chat. But with a 42x P/E and 3.4x book, are we pricing in Tesla-level dreams for what’s still a TMT rebars mart?
2. Introduction with Hook
SG Mart is the financial equivalent of a roadside iron rod shop suddenly building a space shuttle. From ₹2 Cr sales in FY23 to ₹5,456 Cr in FY25 — it’s not growth, it’s a financial reincarnation.
Think of it as India’s own “From Kirana to Conglomerate” story. Sanjay Gupta’s relatives (Meenakshi & Dhruv) acquired the company, fired up the APL Apollo engine, and turned it from rusty to roaring in quarters flat.
You blink — it’s a rebars distributor. You blink again — it’s doing solar infra.
3. Business Model (WTF Do They Even Do?)
Originally? A steel distributor. Now? A steel-and-everything megamart:
- Product Categories (27+):
TMT rebars, wires, binding mesh, bath fittings, paints, tiles, cement — everything a Bharat Builder needs. - SKUs (2,500+):
From construction raw materials to polished bathroom dreams. - Renewables?
Just signed a ₹266 Cr order for solar mounting structures. Because why not throw solar panels on top of steel rebars?
Business model: If it stacks, glues, bolts, or shines — SG Mart sells it.
4. Financials Overview
| Metric | FY23 | FY24 | FY25 (Est.) | TTM |
|---|---|---|---|---|
| Revenue | ₹2 Cr | ₹2,683 Cr | ₹5,512 Cr | ₹5,456 Cr |
| Net Profit | ₹0 Cr | ₹61 Cr | ₹94 Cr | ₹96 Cr |
| ROE | 1% | 8% | 8.2% | 8.2% |
| OPM | 2% | 2% | 2% | 2% |
Yes, 5000x revenue growth in 2 years. Let that sink in.
But margins are paper-thin. That’s retail steel for you — high volume, low cushion. Also, ₹90 Cr of other income inflates profit.
5. Valuation
- P/E: 41.9x
- P/BV: 3.36x
- ROE: 8.2%
Method 1: Normalized P/E
Assuming fair P/E = 20x for 8–10% ROE
FV = ₹96 Cr x 20 = ₹1,920 Cr → ~₹171/share
Method 2: P/B Based
Assume 2x fair P/BV for 8% ROE
FV = ₹107 x 2 = ₹214
Fair Value Range = ₹170 – ₹215
CMP is ₹358. Translation: Valuation is floating higher than their solar frames.
6. What’s Cooking – News, Triggers, Drama
- ₹266 Cr Solar Order: From domestic IPPs, FY26 execution — SG Mart is officially renewable.
- ₹600 Cr Capex: To grow steel capacity from 0.6 MT to 2.5 MT by FY27.
- ₹103 Cr FY25 Net Profit Audited: Clean audit, unmodified opinion.
- Statutory Auditor & CFO Resigned: Classic red flag or restructuring clean-up? Keep watching.
- Open Offer @ ₹450: From Gupta family. Stock now trades 20% below that.
Plot twists? Plenty. This isn’t just a steel mart — it’s a full-blown M&A telenovela.
7. Balance Sheet
| Item | FY25 |
|---|---|
| Equity Capital | ₹11 Cr |
| Reserves | ₹1,187 Cr |
| Borrowings | ₹689 Cr |
| Total Assets | ₹2,251 Cr |
Borrowings increased, but so did capacity. ₹600 Cr capex over 2 years means we’re heading toward the debt mountain. Net worth looks fine for now, but we’ll revisit in FY27 post expansion.
8. Cash Flow – Sab Number Game Hai
| FY | CFO | CFI | CFF | Net Cash |
|---|---|---|---|---|
| FY23 | ₹32 Cr | ₹-1,106 Cr | ₹1,184 Cr | ₹110 Cr |
| FY24 | ₹-269 Cr | ₹-333 Cr | ₹480 Cr | ₹-122 Cr |
Cash burn is real. Expansion comes at a cost, and SG Mart is writing cheques faster than its receivables arrive. Still, financing flows are stable (for now). Let’s just say: this isn’t a dividend stock anytime soon.
9. Ratios – Sexy or Stressy?
| Metric | Value |
|---|---|
| ROE | 8.22% |
| ROCE | 10.8% |
| OPM | 2% |
| P/E | 41.9x |
| D/E | ~0.58 |
| Working Capital Days | 23.1 |
Margins are low, ROE is average, and valuation is spicy. The saving grace? Working capital is tight and lean. For a steel mart, that’s impressive.
10. P&L Breakdown – Show Me the Money
| Year | Revenue | EBITDA | PAT |
|---|---|---|---|
| FY23 | ₹2,683 Cr | ₹62 Cr | ₹61 Cr |
| FY24 | ₹5,512 Cr | ₹88 Cr | ₹94 Cr |
| TTM | ₹5,456 Cr | ₹90 Cr | ₹96 Cr |
You know what’s growing faster than their topline? The risk of overextension. But for now — they’re milking the steel upcycle and packaging it with paint, tile, and a solar bowtie.
11. Peer Comparison
| Company | Revenue | PAT | ROE | P/E |
|---|---|---|---|---|
| L&T | ₹2.5L Cr | ₹15.2K Cr | 16.5% | 31x |
| NBCC | ₹12K Cr | ₹610 Cr | 25.9% | 48x |
| Rail Vikas | ₹20K Cr | ₹1.3K Cr | 14% | 59x |
| SG Mart | ₹5.5K Cr | ₹96 Cr | 8.2% | 42x |
SG Mart has a Lilliputian PAT but a Gulliver valuation. Not quite a leader yet, but it’s playing in the same sandbox now.
12. Miscellaneous – Shareholding, Promoters
| Category | Jun 2023 | Jun 2025 |
|---|---|---|
| Promoters | 75% | 36.3% |
| FIIs | 0% | 0.91% |
| DIIs | 0% | 5.7% |
| Public | 25% | 57.1% |
Promoter holding halved over one year. Retail is filling the vacuum. Usually, that’s the popcorn moment before volatility kicks in.
Bonus Fact: Number of shareholders up 80x in 4 quarters. This stock is now officially a retail darling.
13. EduInvesting Verdict™
SG Mart is the type of story you tell your grandkids:
“Beta, I bought this steel stock. It turned renewable, then turned into a meme.”
Valuation is frothy, margin is thin, governance turnover is high, and profit is partly inflated by other income. But… growth is undeniable.
A hot-blooded midcap bazaar stock. Not for widows and orphans. But for thrill-seeking smallcap cowboys — this might just be your rodeo.
Written by EduInvesting Team | 25 July 2025
Tags: SG Mart, Steel Sector, Solar Infra, Open Offer, Edu Style Article, EduInvesting Premium


