1. At a Glance
EFC (I) Ltd just dropped a quarter like it’s hot – Q1 FY26 saw revenue up 115% YoY and PAT up a spicy 197%. From obscure leasing biz to “Where did this 774 Cr top-line come from?” this company’s story reads like a startup that discovered Excel. But is this space-for-rent story built on real concrete or just over-leveraged drywall?
2. Introduction with Hook
Imagine leasing office space in 2020. Now imagine doing it profitably during an era when WeWork became WeDon’t. Enter EFC (I) Ltd – a company that took boring square footage and turned it into bottom-line gold. With 774 Cr in TTM revenue and 172 Cr in profit, it’s basically the real estate version of a startup selling Dalgona coffee subscriptions… except it’s working.
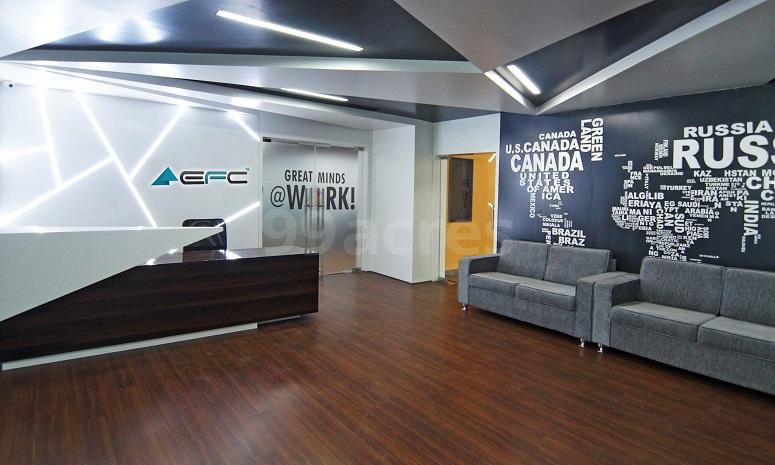
3. Business Model (WTF Do They Even Do?)
EFC (I) Ltd is in the business of leasing office spaces — think plug-and-play workspaces without the bean bags and kombucha taps.
- Primary revenue: Leasing managed office spaces, mainly in Tier-1 & Tier-2 cities.
- Clientele: Corporates that don’t want long-term headaches.
- Assets: Acquiring properties, sprucing them up, and renting them out like the Airbnb of boardrooms.
Basically, they’re doing what coworking startups failed to do—make money.
4. Financials Overview
Let’s talk numbers and throw shade while we’re at it.
Metric | FY23 | FY24 | FY25 | TTM |
---|---|---|---|---|
Revenue (Cr) | 103 | 410 | 657 | 774 |
EBITDA (Approx) | 55 | 173 | 328 | 383 |
PAT (Cr) | 4 | 63 | 141 | 172 |
EPS (Rs) | 0.63 | 5.82 | 11.33 | 13.26 |
OPM % | 54% | 42% | 50% | 50% |
Margins? Still tighter than your Uber driver’s lane-changing skills.
Net profit? Up 197% YoY this quarter. If this were a movie, it’d be called “The Lease Awakens.”
5. Valuation
EFC (I) is trading at a P/E of ~26, with decent ROE (23.3%) and ROCE (21.4%).
Fair Value Range (FY26E):
- P/E 20x–25x on FY26E EPS (~Rs 14–16): Rs 280–400
- EV/EBITDA 18x on FY26E EBITDA (~Rs 400 Cr): ~Rs 375–410/share
Let’s be real. If you’re paying Rs 348 for a company that doesn’t pay dividends and keeps raising debt like a college student on credit cards, hope you like drama with your spreadsheets.
6. What’s Cooking – News, Triggers, Drama
Q1 FY26 was a blockbuster:
- Revenue up 115% YoY
- PAT up 197% YoY
- New Pune property acquisition – because apparently one more campus won’t kill the balance sheet
- Rs 242 Cr preferential issue funds deployed as per plan (good to know someone’s actually using investor money sensibly)
Concall had more numbers than Netflix’s subscriber chart.
7. Balance Sheet
Metric | Mar 2022 | Mar 2023 | Mar 2024 | Mar 2025 |
---|---|---|---|---|
Equity Capital | 0.70 | 7 | 10 | 20 |
Reserves | 1 | 66 | 417 | 523 |
Borrowings | 0 | 324 | 406 | 878 |
Total Liabilities | 2 | 476 | 956 | 1,699 |
Total Assets | 2 | 476 | 956 | 1,699 |
Debt isn’t Titanic-level, but yeah… that iceberg is visible. Borrowings more than doubled in FY25. CFO must have Ctrl+C, Ctrl+V’d the loan application form.
8. Cash Flow – Sab Number Game Hai
Year | CFO (Cr) | CFI (Cr) | CFF (Cr) | Net Flow |
---|---|---|---|---|
FY22 | -0.0 | +1 | 0 | +1 |
FY23 | -51 | -35 | +89 | +2 |
FY24 | +29 | -110 | +263 | +182 |
FY25 | +134 | -105 | -24 | +4 |
Free cash flow? Rare sighting. They’ve got a Netflix-like cash burn model… except they made profits too. Respect.
9. Ratios – Sexy or Stressy?
Metric | FY23 | FY24 | FY25 |
---|---|---|---|
ROE (%) | 11% | 19% | 23% |
ROCE (%) | 11% | 19% | 21% |
P/E | 26.3x | ||
D/E | 0.00 | 0.83 | 1.68 |
OPM (%) | 54% | 42% | 50% |
ROE is hotter than your ex’s rebound.
D/E went from clean to caffeine-fueled real quick.
10. P&L Breakdown – Show Me the Money
FY | Sales (Cr) | EBITDA (Cr) | PAT (Cr) |
---|---|---|---|
FY22 | 0 | 0 | 0 |
FY23 | 103 | 55 | 4 |
FY24 | 410 | 173 | 63 |
FY25 | 657 | 328 | 141 |
TTM | 774 | 383 | 172 |
From Rs 0 to Rs 774 Cr in 3 years. That’s not growth — that’s teleportation.
11. Peer Comparison
Company | Rev (TTM Cr) | PAT (Cr) | P/E | ROCE (%) |
---|---|---|---|---|
EFC (I) | 774 | 172 | 26.3 | 21.4 |
Softsol India | 58 | 13 | 43.3 | 9.7 |
P.E. Analytics | 44 | 13 | 17.0 | 21.3 |
Homesfy Realty | 59 | -0.2 | 63.3 | 4.6 |
EFC looks like the sober guy at a party full of penny stock junkies.
12. Miscellaneous – Shareholding, Promoters
Quarter | Promoter Holding | FII | DII | Public |
---|---|---|---|---|
Sep ‘22 | 75.95% | 0% | 0% | 24.05% |
Jun ‘25 | 45.44% | 4.22% | 5.14% | 45.20% |
Promoter holding down 30% in 3 years
Maybe they know something. Or maybe they’re just tired of working.
Also:
- Shareholders up 40x since FY22
- No dividend since inception – This stock believes in love, not money.
13. EduInvesting Verdict™
EFC (I) Ltd is the real estate dark horse we didn’t see coming. From zero revenue in FY22 to ₹774 Cr today — it’s either a genius land banking play or a case study for future MBA books.
Decent pit stop for those who believe office leasing is back (minus the cappuccino machines). But watch the debt addiction and promoter exits like a hawk.
Just because it’s profitable now, doesn’t mean it can’t lease you into trouble later.
Metadata:
Written by EduInvesting Team | 25 July 2025
Tags: EFC (I) Ltd, Real Estate, Office Leasing, EduInvesting Premium