1. At a Glance
ACC just posted a ₹6,014 Cr revenue cement block for Q1 FY26, with ₹778 Cr EBITDA and ₹375 Cr net profit. Volumes are up, operating margins are… well, trying. Adani-backed, acquisition-hungry, and investing heavily in plants and sustainability, ACC is the bricklayer of India’s infra dreams—just don’t ask about their stock price over the last 3 years unless you enjoy horror stories.
2. Introduction with Hook
Imagine a bodybuilder in a construction helmet who lifts cement bags for protein—now imagine he gets winded after climbing stairs. That’s ACC Ltd for you: heavyweight presence, ancient legacy, but lately struggling to flex. While revenue bulked up 14% YoY (thanks to volume growth), PAT came in 22% lower QoQ. Still, they’ve got 94% business in cement—because clearly diversification is for the weak.
3. Business Model (WTF Do They Even Do?)
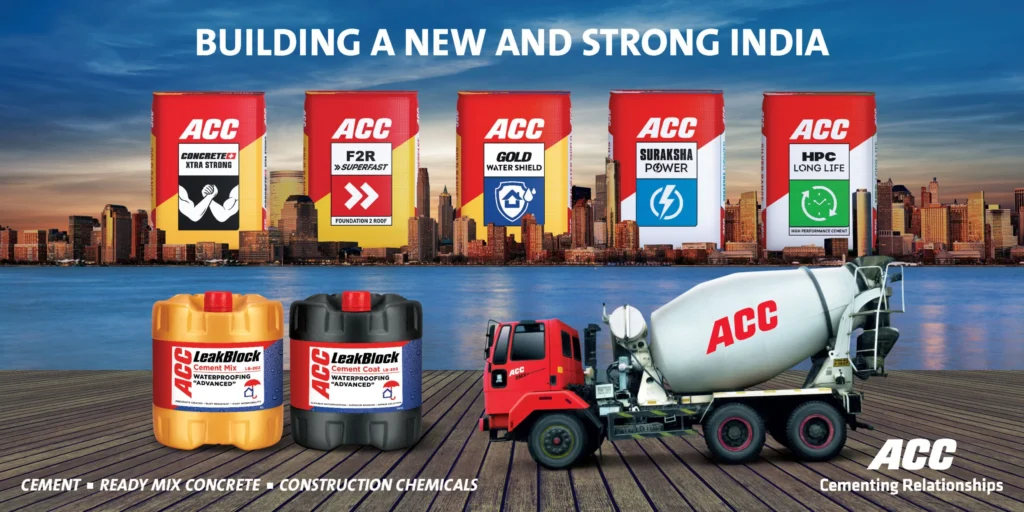
Basically, they dig up limestone, crush it, bake it, grind it, and sell it as if it’s platinum dust. ACC sells cement and ready-mix concrete (RMC), two things that make India’s infrastructure rise and investors’ blood pressure rise too. Two product buckets:
- Gold Range – For premium folks who don’t bargain
- Silver Range – For mass market builders who apply cement with hope
Also, they’re into RMC. Because if it can be mixed in advance, why not?
4. Financials Overview
Let’s pour the concrete on actual numbers:
| Metric | Q1 FY26 | Q1 FY25 | YoY Growth |
|---|---|---|---|
| Revenue | ₹6,014 Cr | ₹5,199 Cr | 15.7% |
| EBITDA | ₹778 Cr | ₹679 Cr | 14.6% |
| Net Profit | ₹375 Cr | ₹360 Cr | 4.2% |
| OPM | 13% | 13% | Flat |
| Realization/ton | ₹5,092 | ₹4,973 | +2.4% |
Margins? About as stable as a Jenga tower in an earthquake.
5. Valuation
Fair Value Range: ₹1,950–₹2,150
Let’s slice it two ways:
- P/E Valuation: EPS (TTM) = ₹128.75. At 17x (industry average), FV = ₹2,189
- EV/EBITDA Valuation: EBITDA = ₹3,160 Cr; EV/EBITDA of 10x → EV = ₹31,600 Cr → Market Cap = EV – Net Debt = ~₹34,000 Cr → FV = ₹2,060/share
If you think paying more than 20x for cement is smart, you probably order mineral water in local trains.
6. What’s Cooking – News, Triggers, Drama
- Sindri Unit: New capacity added. Adani’s cement empire now extends to Jharkhand too.
- Sustainability: Green cement initiatives. Because greenwashing > margin washing.
- Acquisitions: Sniffing around for M&A to bulk up further.
- Digital Initiatives: No, not NFTs of cement bags. But yes, digital logistics and SAP upgrades.
Basically, they’re diversifying… the press releases, not the revenue streams.
7. Balance Sheet
| Metric (FY25) | Amount (₹ Cr) |
|---|---|
| Equity | ₹188 |
| Reserves | ₹18,367 |
| Borrowings | ₹430 |
| Total Liabilities | ₹25,413 |
| Total Assets | ₹25,413 |
Key callouts:
- Debt: Manageable, but showing signs of “Adani-fication”
- Assets: Heavy on fixed plants and WIP. Basically, cement is asset-heavy because it ain’t a software company.
8. Cash Flow – Sab Number Game Hai
| FY | CFO | CFI | CFF | Net Cash |
|---|---|---|---|---|
| FY23 | -1235 | -4637 | -1238 | -7110 |
| FY24 | 2995 | -1205 | -443 | 1347 |
| FY25 | 1711 | -1262 | -1002 | -553 |
Summary:
Operating cash is back. But investing outflows are like gym bros—consistently heavy. Financing = dividends so small you’d miss them if you blinked.
9. Ratios – Sexy or Stressy?
| Ratio | FY25 |
|---|---|
| ROE | 13.2% |
| ROCE | 17.4% |
| PAT Margin | 11.1% |
| D/E Ratio | 0.02 |
| P/E | 15.2 |
ROCE is holding like Shah Rukh in DDLJ—firm, emotional, iconic. ROE? Better than bank FDs, but not enough to brag about on Twitter.
10. P&L Breakdown – Show Me the Money
| Metric (₹ Cr) | FY23 | FY24 | FY25 |
|---|---|---|---|
| Revenue | 22,210 | 19,959 | 21,762 |
| EBITDA | 1,925 | 3,062 | 3,061 |
| PAT | 885 | 2,335 | 2,418 |
Commentary:
Revenue’s back from post-COVID hangover. PAT doubled in 2 years. But EPS growth is slower than a government file transfer.
11. Peer Comparison
| Company | Rev (Cr) | PAT (Cr) | P/E |
|---|---|---|---|
| UltraTech Cem. | ₹77,752 | ₹6,910 | 52.47 |
| Ambuja Cements | ₹35,044 | ₹4,142 | 36.87 |
| Shree Cement | ₹19,282 | ₹1,117 | 102.5 |
| JK Cements | ₹12,424 | ₹916 | 55.82 |
| ACC Ltd | ₹22,743 | ₹2,418 | 15.19 |
Looks like the least drunk guest at a wedding full of finance bros. Solid numbers, but not the life of the party.
12. Miscellaneous – Shareholding, Promoters
| Stakeholders | Jun 2025 |
|---|---|
| Promoters (Adani) | 56.69% |
| FIIs | 4.66% |
| DIIs | 24.13% |
| Public | 14.36% |
Fun Fact: Number of shareholders went from 1.4 lakh to 2.2 lakh in 3 years. More retail investors in ACC than people who can spell “clinker.”
Also:
- Dividend payout = just 6%. So if you’re investing for income, try bank FDs or buying property in GTA Vice City.
13. EduInvesting Verdict™
ACC is like that overachieving cousin who topped boards but now works in their family business. Solid heritage, stable margins, room for growth. But also slow-moving, capital-heavy, and prone to external shocks like fuel and freight.
Verdict:
A decent pit stop in the Adani expressway of cement. But don’t expect business class legroom.
Metadata:
Written by EduInvesting Team | July 25, 2025
Tags: ACC Ltd, Cement, Q1 FY26, Analysis, Adani, EduInvesting Premium
