1. At a Glance
V-Mart Retail just pulled a 177% jump in PAT in Q1 FY26, but hold the confetti — we’re still looking at a 121x P/E for a value retailer. It added 15 new stores, taking the total to 510, but with ROE at just 3%, you might be wondering if they’re selling clothes or investor patience.
2. Introduction with Hook
Picture this: A retail chain trying to conquer India’s small towns, one kurta at a time, while trading like it’s Apple during an iPhone launch. That’s V-Mart — the underdog with ambition, but margins that fluctuate like an Indian soap opera.
In Q1 FY26, it clocked ₹885 Cr in revenue (+13% YoY) and ₹34 Cr in PAT, a comeback from quarters that looked like financial horror flicks. But is this momentum or just festive season leftovers?
3. Business Model (WTF Do They Even Do?)
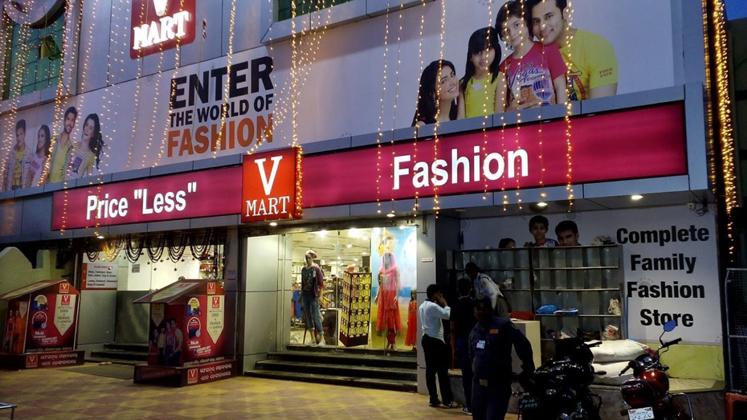
V-Mart runs 510 stores across tier II/III/IV India — think value fashion for Bharat, not Bandra.
Product Mix:
- 85% Apparel (aka fast fashion, but without the “fashion”)
- 15% Non-apparel & Kirana (because someone had to buy plastic buckets too)
It’s like D-Mart’s cousin who decided to sell jeans instead of rice. The model is simple: open stores, sell cheap, manage chaos.
4. Financials Overview
Metric | FY25 | Q1 FY26 |
---|---|---|
Revenue | ₹3,254 Cr | ₹885 Cr |
Net Profit | ₹46 Cr | ₹34 Cr |
OPM % | 12% | 14% |
ROCE | 8.5% | – |
ROE | 3.08% | – |
Despite a strong quarterly recovery, FY25 was still recovering from COVID & expansion stress. ROE is barely sipping chai at 3%, while P/E is partying in the 120s.
5. Valuation
a) P/E Method
- TTM EPS: ₹6.65
- CMP: ₹807
- P/E: 121x
- Fair Value Range (30x–50x): ₹200–₹330
b) EV/EBITDA Method
- FY25 EBITDA: ₹380 Cr
- EV Estimate: ₹6,407 Cr (MCap) + ₹783 Cr (Debt) – ₹122 Cr (Cash) = ₹7,068 Cr
- EV/EBITDA = 18.6x
- Fair Range (12x–16x EV/EBITDA): ₹4,560 Cr – ₹6,080 Cr → ₹570–₹760 per share
Verdict:
This is definitely the Zara of valuation, but with Big Bazaar-level returns.
6. What’s Cooking – News, Triggers, Drama
- Q1 FY26 PAT up 177% – from near zero to actual profit
- 15 new stores opened, taking total to 510
- Penalty: Rs. 11,800 fine paid for delayed board disclosure (at least they’re not hiding)
- Inventory Days: 169 (you sure you’re not secretly a warehouse?)
This quarter’s rebound was great. But one good Diwali doesn’t fix a broken retail cycle.
7. Balance Sheet
Item | FY24 | FY25 |
---|---|---|
Equity Capital | ₹20 Cr | ₹20 Cr |
Reserves | ₹727 Cr | ₹790 Cr |
Borrowings | ₹1,391 Cr | ₹783 Cr |
Total Assets | ₹2,845 Cr | ₹2,436 Cr |
Fixed Assets | ₹1,661 Cr | ₹1,039 Cr |
Key Insight:
They halved their debt in FY25 — a solid move. But net fixed assets also dropped — leased store closures? Write-downs? Hmm…
8. Cash Flow – Sab Number Game Hai
Year | CFO | CFI | CFF | Net CF |
---|---|---|---|---|
FY23 | ₹386 Cr | ₹-118 Cr | ₹-259 Cr | ₹9 Cr |
FY24 | ₹349 Cr | ₹-122 Cr | ₹-215 Cr | ₹12 Cr |
Takeaway:
They’re making cash and not blowing it all — for once. That’s a green flag in the value retail space.
9. Ratios – Sexy or Stressy?
Ratio | Value |
---|---|
ROCE | 8.5% |
ROE | 3.08% |
OPM | 12% |
Inventory Days | 169 |
P/BV | 7.89x |
Commentary:
ROE is sipping coconut water. P/B is climbing Everest. This is either a sleeping giant or a delusional dream.
10. P&L Breakdown – Show Me the Money
Year | Revenue | EBITDA | PAT |
---|---|---|---|
FY23 | ₹2,786 Cr | ₹215 Cr | ₹-97 Cr |
FY24 | ₹3,254 Cr | ₹380 Cr | ₹46 Cr |
TTM | ₹3,353 Cr | ₹404 Cr | ₹67 Cr |
Analysis:
That PAT turnaround from ₹-97 Cr to ₹67 Cr is commendable. But this isn’t a growth stock — it’s a recovery play. And recovery plays don’t usually cost 121x earnings.
11. Peer Comparison
Name | Rev (Cr) | PAT (Cr) | P/E | ROE |
---|---|---|---|---|
Avenue Supermarts | ₹61,648 | ₹2,706 | 96x | 13.4% |
Vishal Mega Mart | ₹10,716 | ₹632 | 103x | 10.5% |
V-Mart Retail | ₹3,353 | ₹67 | 121x | 3.1% |
Shoppers Stop | ₹4,719 | ₹18 | 327x | 3.4% |
Key Line:
Valuation-wise, V-Mart is less D-Mart, more Wish.com D-Mart — expensive for its scale, but banking on sentiment.
12. Miscellaneous – Shareholding, Promoters
Category | Jun ’25 |
---|---|
Promoters | 44.19% |
FIIs | 18.29% |
DIIs | 31.51% |
Public | 6.02% |
Shareholders | 23,901 |
Notes:
- Promoter holding stable but low — doesn’t scream “skin in the game”
- FIIs increasing stake — foreign hope or misread label?
13. EduInvesting Verdict™
V-Mart is a fantastic value retail story — just not at this price. Q1 looks great, but history says otherwise. Unless growth accelerates like their inventory days, this might remain a boutique bet with mass-market dreams.
A low-margin kurta trying to walk a Louis Vuitton ramp.
Metadata:
Written by EduInvesting Team | July 25, 2025
Tags: V-Mart, Value Retail, Tier 2 Markets, EduInvesting Premium