ITL Industries Ltd H1 FY26 Results | When Machines Cut Metal, Margins Cut Jokes – ₹90.9 Cr Revenue, ₹4.82 Cr PAT, EPS ₹15.11, ROCE 15.6%, P/E 9.98 – Industrial Comedy at its Finest
1. At a Glance
When Indore-based ITL Industries sneezes, the entire saw machine ecosystem catches a cold. With a market cap of ₹97.4 crore and a stock price hovering around ₹304, the company might not make headlines on Dalal Street — but it certainly makes headlines in the world of metal cutting. For H1 FY26 (April–September 2025), ITL reported revenue of ₹90.9 crore and PAT of ₹4.82 crore, proving yet again that you don’t need AI or semiconductors to make money — just solid steel and sharper blades.
Operating margins for the latest quarter (Q2 FY26) came in around 7.9%, while EPS stood tall at ₹7.96 for the quarter. Annualised, that’s a cool ₹31.84 per share EPS — giving us a P/E ratio of 9.98x, which in today’s world of 80x valuations looks like a discount coupon nobody’s using.
Over the past year, the stock has fallen 28%, proving that value investing in India still requires nerves stronger than tungsten carbide. Yet, ROCE stands at 15.6%, debt-to-equity is a mild 0.25, and promoters hold a clean 45%, so ITL isn’t exactly crying in the workshop.
So, does this machine maker have gears turning for the long haul, or is it idling in neutral? Let’s unbolt this story piece by piece.
2. Introduction
Once upon a time in Indore — yes, the same city that gave us poha, sev, and random startup founders — a small engineering company decided to make India cut metal better. That’s ITL Industries, born in 1985 when manufacturing wasn’t “Make in India,” it was “Make do with what we have.”
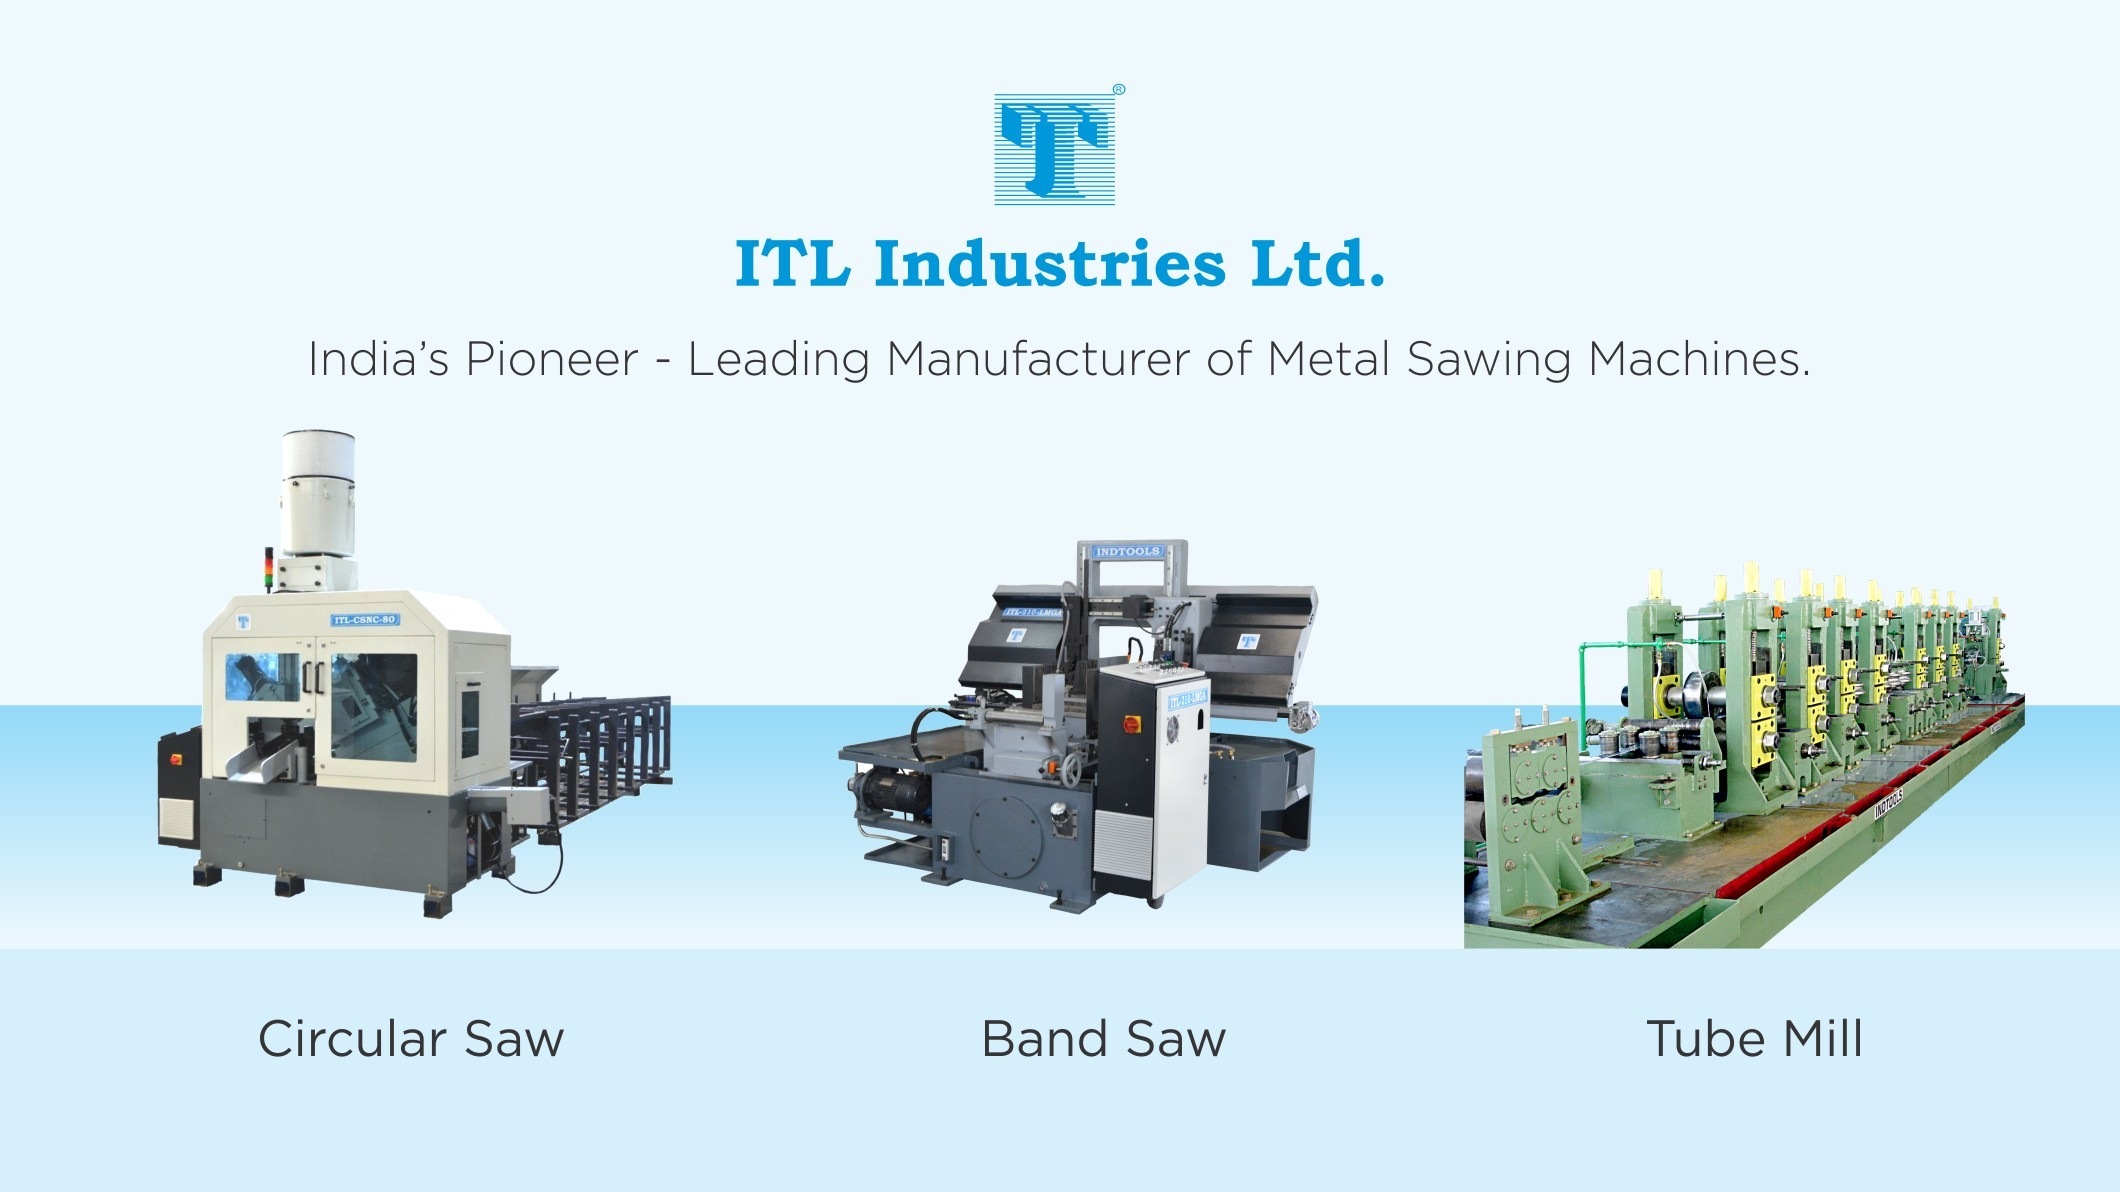
Today, ITL designs and builds over 52 different models of band saw and circular saw machines, capable of cutting everything from thin steel rods to industrial-grade slabs that could anchor a ship. In a world obsessed with software margins, ITL quietly continues its romance with hardware precision.
But don’t mistake its small size for weakness. ITL exports to Poland, Germany, the USA, Brazil, and even Lebanon — because apparently, there’s no border for sharp machines and sharper pricing. Its clientele spans power plants, fabrication units, CNC production shops, and transmission tower manufacturers, proving that when steel needs a haircut, ITL holds the scissors.
Yet, beneath the grease and gears, this company hides an R&D centre recognized by the Department of Scientific and Industrial Research (DSIR). That’s right — a machine maker with scientific ambitions. Their R&D spend was 2.28% of revenue in FY22, which in small-cap land is like buying caviar on a samosa budget.
So, while everyone else is writing AI models, ITL is quietly perfecting the art of slicing through profits — literally.
3. Business Model – WTF Do They Even Do?
Think of ITL Industries as the “Maruti Suzuki” of saw machines — reliable, affordable, and oddly everywhere. Their bread and butter? Designing and manufacturing band saw and circular saw machinery for industrial cutting applications.
They have horizontal saws for the basic cuts, vertical saws for precision maniacs, and carbide circular saws for high-speed steel assassinations. Each category has more variants than a smartphone brand’s lineup — from semi-automatic to NC controlled, from mitre swivel to jumbo gentry types. If you can dream it, they’ll probably cut it.
They also sell consumables like blades, HSS circular saw blades, micromist oils, and wire brushes under their “Indore Saws and Tools” brand — the machine equivalent of selling razor blades after selling the razor. Smart move.
On the trading side, ITL distributes Eaton hydraulic systems and Siemens India industrial components. That’s the company’s diversification strategy: if you can’t make it, sell it.
In FY22, machine manufacturing contributed ~70% of total revenue, while trading activities made up the remaining 30%. So, while others pivot from hardware to SaaS, ITL said, “Why not keep both and confuse analysts?”
4. Financials Overview
Let’s slice into the latest quarterly numbers — pun very much intended.
Metric
Sep 2025 (Latest Qtr)
Sep 2024 (YoY)
Jun 2025 (QoQ)
YoY %
QoQ %
Revenue (₹ Cr)
48.61
43.67
41.41
11.3%
17.4%
EBITDA (₹ Cr)
3.86
2.76
3.54
39.9%
9.0%
PAT (₹ Cr)
2.56
2.09
2.29
22.4%
11.8%
EPS (₹)
7.96
6.37
7.15
25.0%
11.3%
Annualised EPS = ₹7.96 × 4 = ₹31.84 With a CMP of ₹304, that’s a