At a Glance
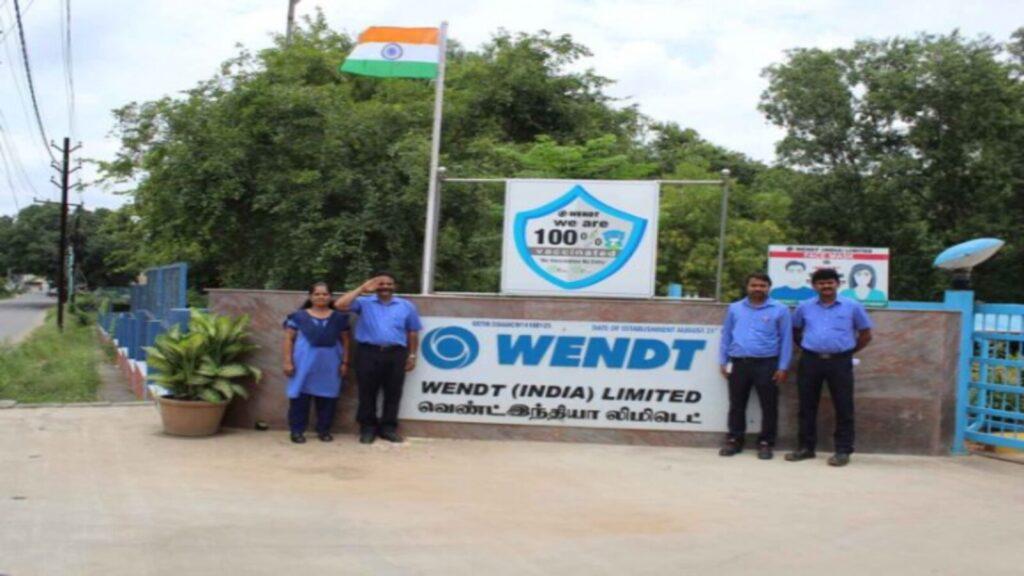
Wendt India Ltd, a joint venture between Murugappa Group’s Carborundum Universal and 3M’s Wendt GmbH, is a niche precision tools manufacturer with a market cap of just ₹1,900 Cr — and a P/E of 55. It dominates India’s super-abrasives and high-precision grinding tools segment, but slow sales growth and declining stock price (-40% in a year) raise serious questions. Is it overvalued legacy or underappreciated moat?
1. 🎣 Introduction with Hook
If Warren Buffett had a soft spot for companies that make things no one understands but everyone needs — he’d probably flirt with Wendt India.
Here’s a ₹9,486 stock:
- With zero debt,
- ₹234 Cr annual revenue,
- A net profit of ₹39 Cr,
- And a monopoly in “super abrasives” (whatever that means to retail bros).
Yet it’s fallen 40% in a year, while still being valued at 55x earnings.
So… what’s going on?
2. 🏭 Business Model (WTF Do They Even Do?)
Wendt India is not your usual boring capital goods company. It’s elite boring.
- 🧱 Core Products: Super abrasives (diamond & CBN grinding wheels), precision components, and specialized machines for grinding, honing, and dressing.
- 🛠️ Customers: OEMs in auto, engineering, ceramics, aerospace, defence.
- 🧬 Niche Tech: Makes customized tooling that works at microns level – basically, surgical-grade equipment for industrial jobs.
- 🤝 JV Structure:
- 37.5% – Carborundum Universal (Murugappa Group)
- 37.5% – Wendt GmbH (a subsidiary of 3M, global abrasives leader)
- Rest: Public
This isn’t just a vendor – Wendt is embedded in manufacturing processes.
3. 💸 Financials Overview – Profit, Margins, ROE, Growth
| Metric | FY23 | FY24 | FY25 |
|---|---|---|---|
| Revenue | ₹210 Cr | ₹227 Cr | ₹234 Cr |
| PAT | ₹40 Cr | ₹41 Cr | ₹39 Cr |
| EPS | ₹200.4 | ₹204.8 | ₹197.4 |
| OPM | 27% | 25% | 23% |
| ROE | 20% | 18% | 15.1% |
📉 Pain Points:
- Sales CAGR (5Y): Just 10%
- Profit CAGR (3Y): Flat at ~10%
- ROE down from 20%+ to 15%
👎 But stock still priced at 55x earnings? Bruh…
4. 🧠 Valuation – Is It Cheap, Meh, or Crack?
Wendt India is:
- At ₹9,486 per share
- Market Cap: ₹1,897 Cr
- P/E: 55x
- P/B: 7.8x
- ROE: 15.1%
Let’s build an FV range based on sanity:
Option A: Realistic
- EPS (FY25): ₹197
- Assume 25x (smallcap industrial avg with decent moat)
- 🎯 Fair Value = ₹4,925
Option B: Premium Niche
- EPS: ₹197
- Assume 35x (niche + JV trust + zero debt)
- 🎯 Fair Value = ₹6,895
➡️ EduInvesting FV Range = ₹4,900–₹6,900
Anything above ₹7K? You’re in Diamond-CBN hallucination zone.
5. 🍿 What’s Cooking – News, Triggers, Drama
- 📉 Stock down 40% YoY – despite profits being stable
- 💰 ₹20 Final Dividend declared in FY25
- 📦 New capex visible – Fixed assets jumped from ₹58 Cr → ₹100 Cr (FY24 → FY25)
- 🏗️ Possible expansion in custom machine manufacturing
- 😴 But no major product launch or segment boom
Basically: company is stable, but excitement is MIA.
6. 💣 Balance Sheet – How Much Debt, How Many Dreams?
| Metric | FY25 |
|---|---|
| Total Assets | ₹301 Cr |
| Cash | ₹45–50 Cr est. |
| Debt | ₹0 (ZERO bro!) |
| Reserves | ₹242 Cr |
✅ No debt
✅ No dilution
✅ No nonsense
Balance sheet toh IIT-rank level clean.
7. 💵 Cash Flow – Sab Number Game Hai
| Year | CFO | CFI | CFF | Net |
|---|---|---|---|---|
| FY25 | ₹34 Cr | ₹-24 Cr | ₹-9 Cr | ₹1 Cr |
| FY24 | ₹30 Cr | ₹-9 Cr | ₹-16 Cr | ₹5 Cr |
| FY23 | ₹33 Cr | ₹-17 Cr | ₹-16 Cr | ₹0 Cr |
Steady positive ops cash flow.
Reinvesting in expansion, dividends regular.
No drama. Just… boring greatness.
8. 🧾 Ratios – Sexy or Stressy?
| Ratio | Value |
|---|---|
| ROCE | 19.8% |
| ROE | 15.1% |
| OPM | 23% |
| D/E | 0 |
| Debtor Days | 107 (up from 70 👎) |
| Inventory Days | 162 |
| Working Capital Days | 94 |
🚨 Red Flag: Debtor Days rising → sluggish collections?
But nothing alarming overall.
9. 📈 P&L Breakdown – Show Me the Money
| FY25 (₹ Cr) | Value |
|---|---|
| Sales | ₹234 |
| EBITDA | ₹53 |
| PAT | ₹39 |
| Other Income | ₹9 |
| Tax Rate | 23% |
| Dividend | ₹20/share (payout down to 10%) |
Earnings flat. Dividend trimmed.
Management hoarding cash? Or planning major reinvestment?
10. ⚔️ Peer Comparison – Who Else in the Game?
| Company | Rev (Cr) | PAT (Cr) | P/E | ROE | OPM |
|---|---|---|---|---|---|
| Wendt India | 234 | 39 | 55x | 15.1% | 23% |
| Timken India | 3148 | 447 | 55.6x | 17% | 18.8% |
| Grindwell Norton | 2812 | 346 | 55.9x | 16% | 18.3% |
| CUMI (Carborundum) | 4894 | 358 | 53.1x | 10.8% | 14.5% |
| SKF India | 4919 | 566 | 43.3x | 21.4% | 14.7% |
Wendt has highest margins, but lowest scale.
Trading at similar P/E as Timken and Norton — despite being ~10x smaller.
That’s Valuation Chutzpah™.
11. 🧬 Miscellaneous – Shareholding, Promoters
| Category | % |
|---|---|
| Promoters (3M + Murugappa) | 75.0% |
| DIIs | 6.7% |
| Public | 18.2% |
| FIIs | 0.09% |
📢 3M’s Wendt GmbH and Murugappa’s CUMI holding = strong skin in the game.
But FII love is missing. Because… nobody understands the damn business.
12. 🧑⚖️ EduInvesting Verdict™
Wendt India = Industrial Brahmastra, but priced like it already won Mahabharat.
✅ Best margins in the sector
✅ Debt-free, stable, profitable
❌ But ZERO sales momentum
❌ Stock still at 55x despite being -40% in a year
Unless capex = future hockey-stick, the stock needs a valuation detox.
🎯 FV Range = ₹4,900 – ₹6,900
💡 EduInvestor Gyaan: Sometimes, moats cut deep. But you don’t pay ₹9K for a scalpel when a Swiss Army knife is cheaper.
✍️ Written by Prashant | 📅 July 6, 2025
Tags: Wendt India, Super Abrasives, Murugappa Group, 3M JV, Smallcap Capital Goods, High P/E, EduInvesting, Grinding Tools, Industrial Equipment, Debt Free Stocks

