⚡️ At a Glance
JP Power Ventures has pulled off a shocking financial resurrection—from -₹2,147 Cr loss in FY20 to ₹814 Cr profit in FY25, with a 5-year stock CAGR of 58%. The question now is whether this is a sustainable turnaround or another round of electrifying disappointment powered by debt, pledges, and hope.
1. 🔥 Introduction with Hook
Imagine a power company that once made -₹2,000 Cr in losses, almost went under, was labelled a penny stock by retail bros… and then pulled a Tesla-lite 5x rally in 3 years. That’s JP Power Ventures for you.
But beneath this voltage of optimism lies a tangled grid of thermal plants, debt fires, and promoter pledges at 79%.
So… is this a true rerating story or just another Jaiprakash-flavored pump?
2. ⚙️ Business Model – WTF Do They Even Do?
JP Power is not your usual boring electricity company. It’s a Power + Mining + Cement + Sand Mining mix—all the ingredients for both infra expansion and accounting confusion.
Main revenue segments:
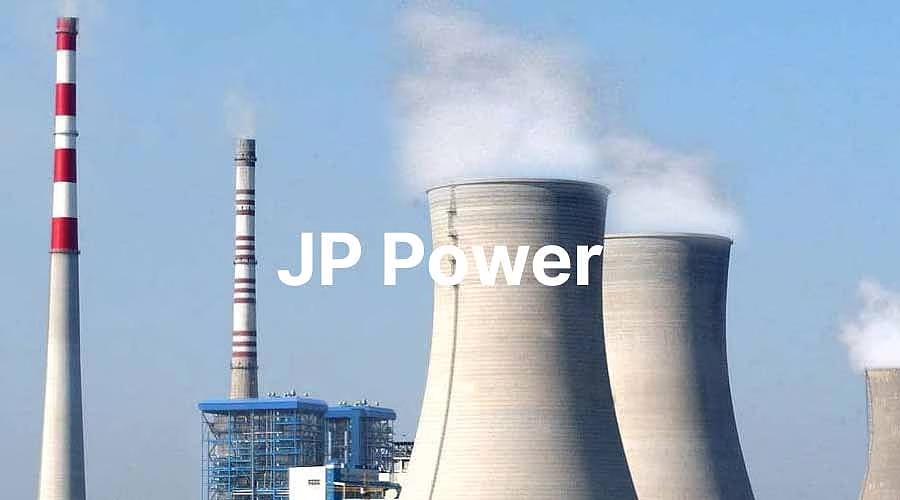
- Thermal Power Plants (1,820 MW total)
- Bina (500 MW)
- Nigrie (1,320 MW)
- Hydropower – Vishnuprayag (400 MW)
- Mining – Sand & Coal (used in-house + sold externally)
- Cement Grinding – Under Nigrie Integrated Complex
Bonus: They’re also into limestone and fly ash handling. Basically, everything that makes power plants run… and investors squirm.
3. 📈 Financials – Profit, Margins, ROE, Growth
Let’s not sugarcoat this—JP Power was a financial graveyard till FY21. But then came the plot twist.
| Metric | FY20 | FY23 | FY25 |
|---|---|---|---|
| Revenue (₹ Cr) | 3,284 | 5,787 | 5,462 |
| Net Profit (₹ Cr) | -2,147 | 55 | 814 |
| OPM (%) | 27% | 19% | 34% |
| ROE (%) | – | 1% | 7% |
| EPS (₹) | -3.16 | 0.08 | 1.19 |
💡 From -₹3.16 EPS in FY20 to ₹1.19 in FY25. That’s not just a comeback—that’s a resurrection.
4. 📊 Valuation – Is It Cheap, Meh, or Crack?
At ₹22.2/share with a P/E of 18.6 and Book Value of ₹17.9, it trades at 1.2x Book and ~18x trailing EPS.
Let’s try a Fair Value Range:
- Assume sustainable PAT of ₹700–900 Cr (mid-cycle)
- EPS = ₹1.02 – ₹1.31 (with equity capital at ₹6,853 Cr)
- Assign P/E of 12–15 (conservative for thermal + pledged group)
FV Range = ₹12 to ₹20
➡️ Current price is already above this zone, so you’re paying for growth that hasn’t fully arrived yet.
5. 🔍 What’s Cooking – News, Triggers, Drama
- 🏭 Operating Margin Jumped to 48% in Q4 FY24 and 45% in Q1 FY25 — thanks to lower coal costs
- 🔁 Debt reduced from ₹23,000 Cr+ in FY18 to ₹3,778 Cr in FY25
- 🎯 Turnaround story + retail FOMO + infra capex = massive re-rating
- 📣 AGM done on July 5, no dividends declared (again)
Trigger Watchlist:
- IPO of subsidiary or asset monetization?
- Promoter pledge reduction?
- Large capex cycle like UMPPs rebooting?
6. 🧾 Balance Sheet – How Much Debt, How Many Dreams?
The cleanup has been actually impressive:
| Year | Debt (₹ Cr) | Networth (₹ Cr) | D/E Ratio |
|---|---|---|---|
| FY18 | 23,416 | ~7,800 | ~3.0x |
| FY25 | 3,778 | ~12,300 | ~0.3x |
➡️ That’s a 10x drop in leverage over 7 years.
But don’t break out the champagne—reserves are still modest, and equity capital is bloated from past dilution.
7. 💸 Cash Flow – Sab Number Game Hai
| Year | CFO (₹ Cr) | FCF (est.) |
|---|---|---|
| FY20 | ₹1,028 | Likely negative |
| FY25 | ₹1,714 | Strongly positive |
Capex is now stable. And cash flows finally look legit, not just “restructured” with creative accounting.
Still, no dividend for 5+ years despite ₹800+ Cr profit. Why? Maybe the debt hangover trauma is still real.
8. 📐 Ratios – Sexy or Stressy?
| Metric | FY23 | FY24 | FY25 |
|---|---|---|---|
| ROE (%) | 1% | 7% | 7% |
| ROCE (%) | 5% | 14% | 10% |
| Interest Coverage | 1.5x est. | 3.5x est. | 4.9x est. |
🔋 Decent improvement but still not NTPC-level safety.
9. 📦 P&L Breakdown – Show Me the Money
Q4FY25 snapshot:
- Revenue: ₹1,341 Cr
- EBITDA: ₹388 Cr
- PAT: ₹156 Cr
- EPS: ₹0.23
Quarterly margins and profit are yo-yo-ing hard. From ₹589 Cr PAT in Q4FY24 to ₹156 Cr now—a 75% drop.
Conclusion? You’re buying into a turnaround that’s still learning to walk.
10. 🤼 Peer Comparison – Who Else in the Game?
| Company | P/E | ROE | OPM | Div Yield | D/E |
|---|---|---|---|---|---|
| NTPC | 13.9 | 13.6% | 28% | 2.3% | 1.0x |
| JSW Energy | 49.8 | 7.4% | 44% | 0.4% | 1.3x |
| SJVN | 47.5 | 5.8% | 72% | 1.8% | 1.8x |
| JP Power | 18.6 | 6.8% | 34% | 0% | 0.3x |
🧠 Takeaway: Valuation still lags peers—but so does credibility.
11. 🎭 Miscellaneous – Promoters, Public, Drama
- Promoter Holding: 24%
- Pledged Shares: 79.2% 🤯
- FII Holding: 6.3% (up from 2.8% in 2022)
- Public Holding: Massive 52.17%
- Retail Shareholders: 2.5 million+
This is now a retail darling. But with pledge this high, all it takes is one slip for a spiral.
12. 🧑⚖️ EduInvesting Verdict™
JP Power is what happens when a zombie stock finds a power cable.
✅ 5X in 3 years
✅ Debt cleaned up
✅ Profits are back
❌ Still no dividend
❌ Promoters still pledged to their eyeballs
❌ Operating metrics bounce like a trampoline
Unless you’re here to trade the narrative, don’t confuse this rerating with a fortress of fundamentals. It’s a wild ride. And when the power cuts again… nobody rings the bell.
Fair Value Range: ₹12–₹20
Tagline: Thermal Power, but make it dramatic.
✍️ Written by Prashant | 📅 July 7, 2025
Tags: JP Power, turnaround stocks, power sector, pledged shares, thermal energy, infra, retail frenzy, BSE Smallcap


