📌 At a Glance
Thangamayil Jewellery Ltd is Tamil Nadu’s homegrown jewellery chain that’s quietly turned into a ₹6,000 Cr gem. With a 5-year CAGR of 72% in stock price and 24% in sales, it’s outperforming most bling biggies — but with a rising debt pile, a 50x P/E, and a tax notice of ₹70 Cr, is this gold too heavy to carry?
1. 🎬 Introduction with Hook
“Titan walks the ramp, Thangamayil walks the street — and still gives 2X the swag.”
You probably haven’t seen a Thangamayil ad on IPL or airport lounges. But in southern Tamil Nadu, they’re a local legend.
In a state that accounts for 40% of India’s gold demand, this 5-decade-old jeweller has:
- Tripled revenue in 3 years
- Grown EPS by 3.5x in 5 years
- And launched a ₹510 Cr rights issue like it’s Ambani’s Diwali sale
2. 💎 WTF Do They Even Do? (Business Model)
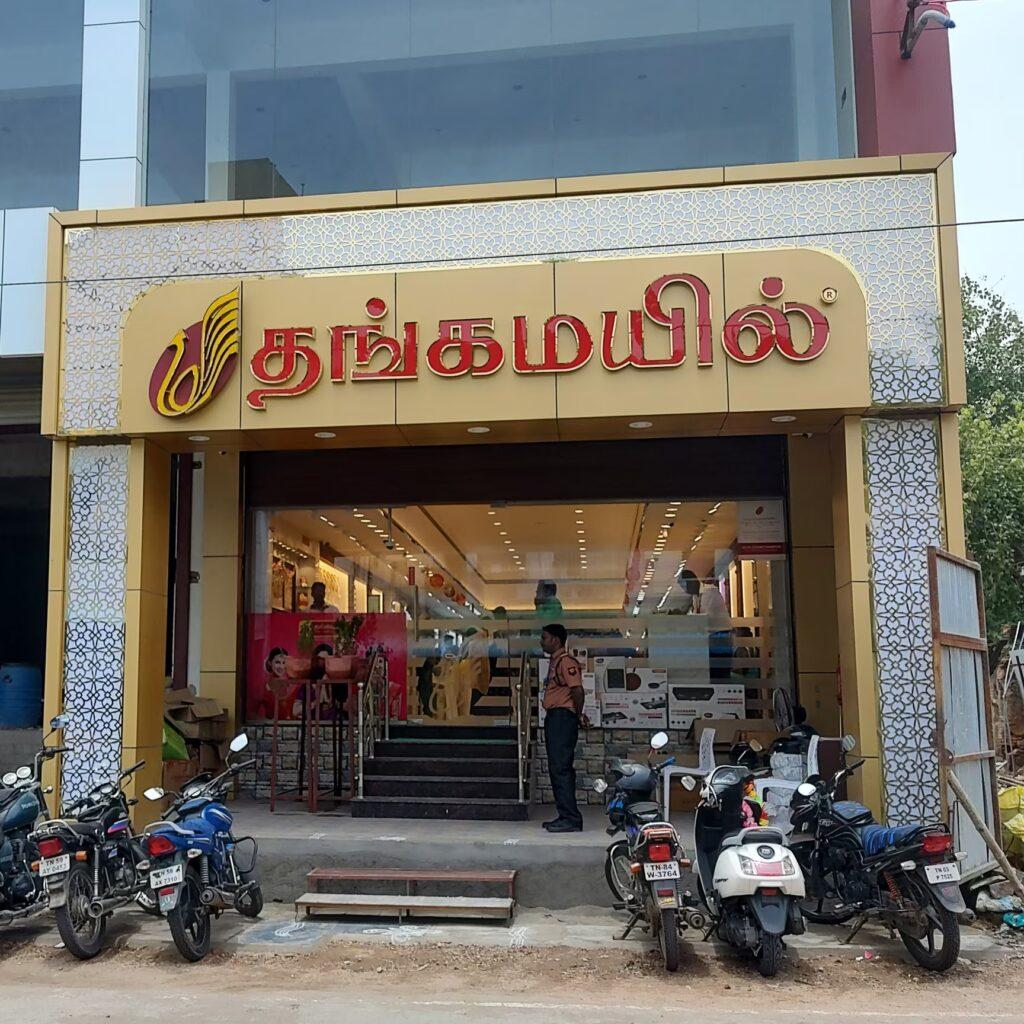
- 🛍️ Operates 50+ retail jewellery outlets across Tamil Nadu
- 👑 75% of revenue from gold jewellery
- 💍 Also sells silver, platinum, and diamond products
- 🧵 4 in-house manufacturing units with own goldsmiths for custom designs
- 🎯 Target audience: aspirational tier-2 and rural gold buyers
Basically: Mini Titan without the Tanishq polish
3. 💰 Financials Overview – Profit, Margins, ROE, Growth
| Metric | FY23 | FY24 | FY25 |
|---|---|---|---|
| Revenue | ₹3,153 Cr | ₹3,827 Cr | ₹4,911 Cr |
| Net Profit | ₹80 Cr | ₹123 Cr | ₹119 Cr |
| OPM | 5% | 6% | 4% |
| ROE | 21% | 20% | 15% |
| ROCE | 17% | 20% | 14% |
- Sales: 🚀 +56% in 2 years
- Profit: Stagnant in FY25 due to rising costs and finance charges
- Margin: Getting squeezed — OPM down to 4% from 6%
4. 📊 Valuation – Is It Cheap, Meh, or Crack?
| Metric | Value |
|---|---|
| CMP | ₹1,928 |
| EPS (TTM) | ₹38.2 |
| P/E | 50.5x |
| P/B | 5.4x |
| Book Value | ₹355 |
| Dividend Yield | 0.65% |
| Market Cap | ₹5,992 Cr |
Fair Value Estimate:
Assume FY26 EPS of ₹48, and assign a conservative 25–30x P/E (vs Titan’s 90x):
👉 Fair Value Range = ₹1,200 – ₹1,440
Currently, the stock is running hot like a dosa tawa.
5. 🔥 What’s Cooking – News, Triggers, Drama
- 🏦 ₹510 Cr Rights Issue approved (funds for expansion + working capital)
- 💰 Tax demand of ₹70 Cr – challenged in court
- 🛍️ Akshaya Tritiya FY25 sales = ₹162 Cr (📈 45% YoY)
- 📉 Promoter stake fell by 5.17% in 3 years
- 🧨 FY25 PAT down 3.5% YoY despite higher sales
- 😨 Q2FY25 operating loss of ₹7 Cr
TL;DR: Great topline momentum, but bottomline isn’t shining as much lately.
6. 🧾 Balance Sheet – How Much Debt, How Many Dreams?
| Metric | FY23 | FY24 | FY25 |
|---|---|---|---|
| Net Worth | ₹389 Cr | ₹493 Cr | ₹1,102 Cr |
| Borrowings | ₹571 Cr | ₹532 Cr | ₹797 Cr |
| Fixed Assets | ₹120 Cr | ₹154 Cr | ₹201 Cr |
| Total Assets | ₹1,247 Cr | ₹1,481 Cr | ₹2,559 Cr |
- Debt has risen ₹225 Cr in FY25
- Debt-to-equity = 0.72x ✅ manageable
- But the sudden jump in reserves = partly due to rights issue
7. 💵 Cash Flow – Sab Number Game Hai
| FY | CFO | FCF | CFI | CFF |
|---|---|---|---|---|
| FY24 | ₹330 Cr | ₹300 Cr | ₹-30 Cr | ₹-293 Cr |
| FY25 | ₹-424 Cr | NA | ₹-138 Cr | ₹637 Cr |
- FY25 Operating Cash Flow = -₹424 Cr 😬
- Expansion + high inventory buildup hit working capital
- ₹637 Cr inflow via financing (mostly rights money)
8. 📐 Ratios – Sexy or Stressy?
| Ratio | FY24 | FY25 |
|---|---|---|
| Inventory Days | 127 | 164 👎 |
| Payable Days | 2 | 3 |
| CCC | 125 | 162 📉 |
| Working Capital Days | 73 | 106 👎 |
| ROCE | 20% | 14% 🔻 |
| ROE | 20% | 15% 🔻 |
They’re holding a lot of inventory, but margins aren’t rising in proportion. Classic gold biz problem.
9. 💸 P&L Breakdown – Show Me the Money
- Sales up ₹1,084 Cr YoY
- PAT down by ₹4 Cr YoY
- FY25 EPS: ₹38.2
- Finance costs: ₹41 Cr
- No other income = real core profit story
Conclusion: They’re working hard, but earnings are jogging
10. ⚔️ Peer Comparison – Who Else in the Game?
| Company | P/E | ROE | OPM | Market Cap |
|---|---|---|---|---|
| Titan | 91x | 31.8% | 9.4% | ₹3.03 L Cr |
| Kalyan Jewellers | 85x | 15.9% | 6.0% | ₹60.6K Cr |
| PNG Jewellers | 37x | 20.9% | 4.4% | ₹8K Cr |
| Thangamayil | 50x | 14.9% | 4.5% | ₹6K Cr |
Verdict: Priced closer to Titan, margins closer to PNG
11. 🧪 Miscellaneous – Shareholding, Promoters
| Shareholder | % (Mar 2025) |
|---|---|
| Promoters | 61.49% 🔻 |
| FIIs | 4.41% 🔼 |
| DIIs | 14.80% 🔼 |
| Public | 19.29% |
- Promoter holding declined from 67.3% → 61.5% in one year
- Institutions increasing stake = ✅
- Public stable
12. 🎭 EduInvesting Verdict™
We Like:
- 🛍️ Strong regional brand with consistent footfalls
- 📈 Sales compounding at 30%+
- 💸 45% jump in festival sales = ground momentum
We Don’t:
- 🚨 EPS flat despite 28% sales growth
- 💸 Negative cash flow in FY25
- 💰 Rights issue dilution + rising debt
- ⚖️ Open tax litigation = ₹70 Cr uncertainty
Verdict: Thangamayil may be gold, but it’s trading like diamond. Pricey, pretty, but pressure’s building.
Fair Value Range = ₹1,200 – ₹1,440
✍️ Written by Prashant | 📅 July 11, 2025
SEO Tags: Thangamayil Jewellery stock analysis, gold jewellery stocks India, Titan vs Thangamayil, Tamil Nadu jewellers, Thangamayil EPS FY25, rights issue jewellery company, jewellery stock PE comparison


