At a Glance
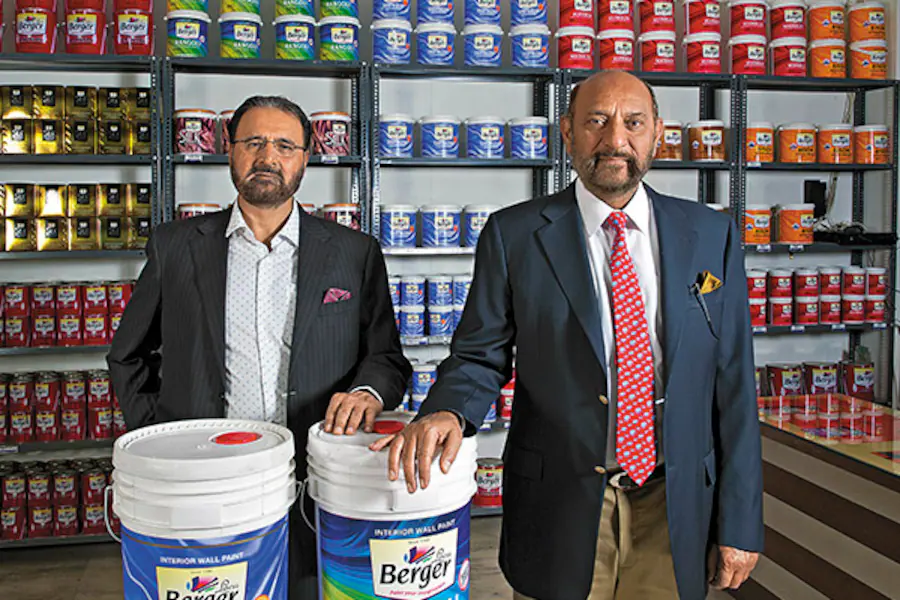
Berger Paints is India’s second-largest paint company and the seventh-largest decorative paint company globally. With ROCE above 25%, margins holding strong at 16%, and an industry-best OPM expansion in FY24, it’s also trading at a nosebleed P/E of 57. So is this a quality compounding classic or just a very expensive shade of blue?
1. 🎯 Introduction with Hook
If Asian Paints is the Big B of paints, Berger is probably Ranveer Singh — quirky, energetic, and loves over-the-top marketing (remember those Berger WeatherCoat ads?). But here’s the twist: while Asian’s profits dipped last year, Berger’s rose 13%.
So is Berger Paints the quiet multibagger in the making or just expensive acrylics sold in fancy cans?
2. 🧪 WTF Do They Even Do?
Berger Paints makes and sells paints. But don’t let the simplicity fool you — this ₹68,000 Cr behemoth is a master of:
- 🏠 Decorative paints: Emulsions, enamels, distempers, primers, and putty
- 🏭 Industrial coatings: Automotive, general industrial, protective
- 🌍 International biz: Nepal, Poland, Bangladesh, Russia (yes, even now)
They also run tinting machine networks and operate via 16 manufacturing units across India.
3. 💰 Financials Overview – Profit, Margins, ROE, Growth
Here’s how Berger has painted its 5-year financial canvas:
| Metric | FY21 | FY22 | FY23 | FY24 | FY25 |
|---|---|---|---|---|---|
| Revenue (₹ Cr) | 6,818 | 8,762 | 10,568 | 11,199 | 11,545 |
| Net Profit (₹ Cr) | 720 | 833 | 860 | 1,170 | 1,183 |
| EPS (₹) | 6.17 | 7.14 | 7.37 | 10.02 | 10.12 |
| ROE (%) | 22.0 | 21.0 | 20.0 | 20.5 | 20.5 |
| OPM (%) | 17% | 15% | 14% | 17% | 16% |
🧠 TL;DR:
- FY24 Net Profit grew 36%, beating most peers
- OPM recovered smartly after a dip in FY22–23
- ROCE remains elite at 25%+
4. 💸 Valuation – Is It Cheap, Meh, or Crack?
Let’s talk about the only thing more shocking than Berger’s ad budget: its P/E.
- P/E: 57.8
- P/B: 11.1
- EV/EBITDA: 33x+
- Dividend Yield: 0.60% (good luck with that retirement plan)
📉 Fair Value Range Estimate (EduInvesting Calculations):
Assuming FY26 EPS of ₹12.2
- At 35x (fair for FMCG-like paints): ₹427
- At 45x (premium brand multiple): ₹549
- At 55x (crack-level): ₹671
➡️ FV Range = ₹427–₹671
Current price ₹585 = Pricing in perfection already
5. 🔥 What’s Cooking – News, Triggers, Drama
Here’s what’s been hitting Berger’s canvas lately:
- 🧪 Green Ammonia Deal (Mar 2024): Signed for sustainability paints. ESG brownie points ✅
- 🏭 New Unit Land Allotment (Feb 2024): More manufacturing = more topline
- 🔄 Leadership Shakeup (Aug 2024): Chairman & Vice Chairman quit, new faces onboard
- 🔁 Bonus Issue (2023): Because why not?
But the real drama is in margins — Berger outperformed Asian Paints in FY24 on OPM.
6. 🧾 Balance Sheet – How Much Debt, How Many Dreams?
- Total Assets: ₹9,132 Cr
- Borrowings: ₹670 Cr (down from ₹1,189 Cr in FY23)
- Cash & Investments: ~₹1,400 Cr+
- Net Debt: Practically zero = Clean & Mean
Dreams? Well, they just started a green ammonia collab. So yeah, climate-conscious dreams.
7. 💵 Cash Flow – Sab Number Game Hai
Berger is no Reliance. But it knows how to generate cash.
| FY | CFO (₹ Cr) | FCF (est.) |
|---|---|---|
| 2023 | 976 | 600+ |
| 2024 | 1,591 | 1,200+ |
| 2025 | 1,269 | ~900 |
🧠 TL;DR:
- Robust operating cash
- Capex is consistent (~₹400–₹600 Cr annually)
- No cash burn = Compounding engine intact
8. 📊 Ratios – Sexy or Stressy?
| Ratio | Value | Verdict |
|---|---|---|
| ROE | 20.5% | Sexy |
| ROCE | 25.1% | Sexy |
| Debt/Equity | 0.1x | Yoga-level lean |
| OPM | 16% | Stylish |
| Inventory Days | 128 | Okayish |
| Cash Cycle | 82 days | Slightly bloated |
Only concern? Longer cash conversion cycle = some working capital stress.
9. 📈 P&L Breakdown – Show Me the Money
- Revenue growth: Slowing down in FY25 (3%) after a 2-year boom
- Cost control: Smart post-COVID recovery in gross margins
- EPS CAGR: ~13% over 5 years = slow compounding but stable
10. 🧯 Peer Comparison – Who Else in the Paint Game?
| Company | P/E | ROCE (%) | OPM (%) | Sales FY24 (₹ Cr) | PAT FY24 (₹ Cr) |
|---|---|---|---|---|---|
| Asian Paints | 61 | 25.7 | 17.7 | 33,905 | 3,925 |
| Berger Paints | 58 | 25.1 | 16.0 | 11,545 | 1,183 |
| Kansai Nerolac | 34 | 13.0 | 12.0 | 7,823 | 591 |
| Akzo Nobel | 39 | 41.7 | 15.7 | 4,091 | 428 |
| Indigo Paints | 40 | 19.5 | 18.1 | 1,277 | 144 |
Berger is:
- 🥈 2nd biggest by revenue
- 🧠 More efficient than Nerolac
- 💰 Much more expensive than Indigo
- 📉 Trading at similar multiples to Asian Paints without its scale
11. 🧩 Miscellaneous – Shareholding, Promoters, KMP
- Promoter holding: 74.99% (unchanged for 3 years)
- FII stake: down from 11.1% to 5.75% in 2 years
- DII stake: up from 3.5% to 10.11%
- Key People:
- CEO & MD: Abhijit Roy
- CFO: Kaushik Ghosh (appointed Jan 2023)
Institutional rotation clearly visible: FIIs booked profits, DIIs stepped in.
12. 🧑⚖️ EduInvesting Verdict™
Berger Paints is like that friend who always shows up on time, brings snacks, and quietly makes 20% CAGR in ROE while others crash and burn.
BUT…
- Slowing growth in FY25
- P/E of 58 = not for value investors
- Priced for perfection (or maybe apocalypse-resistant paint demand)
🎨 Verdict:
“High-quality stock dipped in expensive enamel. Can keep compounding… if earnings growth returns. Until then, expensive but elite.”
Fair Value Range = ₹427–₹671 (FY26E EPS ₹12.2, valuation multiple of 35x–55x)
✍️ Written by Prashant | 📅 10 July 2025
Tags: Berger Paints, Paint Stocks, Asian Paints vs Berger, OPM trends, Indian Paint Industry, Defensive Stocks, FMCG-like Stocks, EduInvesting, Stock Analysis, DIIs, FIIs, ROCE
