📌 At a Glance
Quality Power Electrical Equipments Ltd makes high-voltage power gear—think transformers, coils, and grid tech powering India’s energy transition dreams. After a breakout FY25, the stock surged 3x in a year. But with a 93x P/E, should investors stay grounded or get charged up?
1. 🎬 Introduction with Hook
“Ek taraf Suzlon, doosri taraf QPower. One is wind, the other is wired. But only one has a P/E of 93.”
Quality Power went from obscurity to “trending stock” thanks to back-to-back order wins, Mehru acquisition, and a jaw-dropping FY25 profit growth of +80% YoY.
But here’s the twist:
This isn’t just a story of profit. This is a full-blown Bharat Infra + Renewables + Manufacturing cocktail.
2. ⚙️ WTF Do They Even Do? (Business Model)
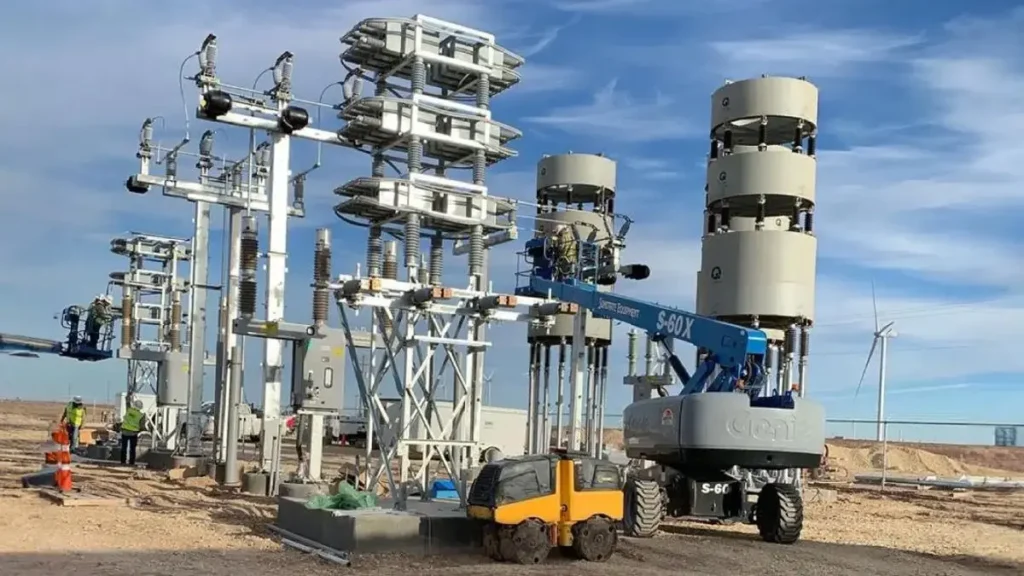
QPower operates in critical energy transition infra — they make:
- 🧲 High-voltage electrical coils
- ⚡ Transformer components
- 🏭 Power grid substation gear
- 🛰️ FACTS (Flexible AC Transmission Systems)
- 📦 Automation & distribution products via Nebeskie Labs
Clients? Indian utilities, international infra EPCs, and renewable integrators.
FY25 milestone:
- Bought 51% of Mehru Electricals for ₹120 Cr
- Now acquiring Sukrut Electric (global transformer components play)
- Building a ₹750 Cr mega coil factory in Sangli (operational by Dec 2026)
3. 💸 Financials Overview – Profit, Margins, ROE, Growth
| Metric | FY24 | FY25 | YoY Growth |
|---|---|---|---|
| Revenue | ₹301 Cr | ₹337 Cr | +12% |
| Net Profit | ₹55 Cr | ₹100 Cr | +80% 🚀 |
| OPM | 13% | 19% | Sharp uptick |
| ROCE | 31% | 28% | Slight dip |
| ROE | 24% | 23% | Solid |
👉 Operating leverage kicked in: despite modest sales growth, PAT doubled.
👉 Other income = ₹54 Cr 👀 (keep an eye).
4. 📊 Valuation – Is It Cheap, Meh, or Crack?
| Metric | Value |
|---|---|
| Current Price | ₹808 |
| P/E | 93.3x |
| P/B | 14.75x |
| Market Cap | ₹6,260 Cr |
| Book Value | ₹54.8 |
| EV/EBITDA (Est.) | ~40x |
Let’s do a fair value rough cut:
Assuming FY26 EPS of ₹12–13 with 40x–50x exit P/E (mid-cap optimism):
👉 Fair Value = ₹480 to ₹650
Conclusion: Current price = premium zone. The stock has priced in perfection.
5. 🔥 What’s Cooking – News, Triggers, Drama
- ✅ FY25 PAT up 80%, Sales up 12%, OPM jumped to 19%
- ✅ ₹750 Cr Coil Plant capex announced – scale-up mode
- ✅ 51% stake in Mehru acquired (Transformer parts biz)
- ✅ Sukrut Electric acquisition initiated (global footprint)
- ✅ ₹20 Cr export order from Israel secured
- ✅ FY25 dividend declared (₹1/share)
But also:
- ⛔ Debtor Days shot up to 214
- ⛔ Working capital cycle ballooned to 169 days
- ⛔ ₹54 Cr in Other Income raises flags — what’s recurring?
6. 🧾 Balance Sheet – How Much Debt, How Many Dreams?
| Metric | FY25 |
|---|---|
| Equity Capital | ₹77 Cr |
| Reserves | ₹347 Cr |
| Borrowings | ₹9 Cr ✅ (almost debt-free) |
| Total Assets | ₹814 Cr |
| Fixed Assets | ₹238 Cr (Post capex boost) |
| Investments | ₹37 Cr |
The ₹750 Cr capex will push up asset base and likely increase borrowings in FY26.
7. 💵 Cash Flow – Sab Number Game Hai
| FY | CFO | CFI | CFF | Net Cash Flow |
|---|---|---|---|---|
| FY25 | ₹62 Cr | -₹93 Cr | ₹171 Cr | ₹141 Cr |
- Investing = Capex-heavy.
- Financing = Fresh equity + cash infusion.
- Net cash flow finally positive after 3 years of red ink.
8. 📐 Ratios – Sexy or Stressy?
| Ratio | FY24 | FY25 |
|---|---|---|
| ROCE | 31% | 28% |
| ROE | 24% | 23% |
| Working Capital Days | 12 | 169 ❗ |
| CCC | 22 | 232 😱 |
| Inventory Days | 43 | 185 |
Verdict: Profits look sexy. But operations need a reality check. Cash conversion cycle ballooned = ⚠️
9. 💸 P&L Breakdown – Show Me the Money
- FY25 sales = ₹337 Cr
- Gross Margin expansion led to ₹65 Cr EBITDA
- Net Profit = ₹100 Cr (thanks to ₹54 Cr other income)
Without other income, core PAT = ₹46 Cr → EPS drops to ₹5
That’s a core P/E of ~160x 😐
10. ⚔️ Peer Comparison – Who Else in the Game?
| Company | P/E | ROE | OPM | Market Cap |
|---|---|---|---|---|
| ABB | 66x | 28.8% | 18.9% | ₹1.2 Lakh Cr |
| Siemens | 60x | 17.6% | 12.0% | ₹1.1 Lakh Cr |
| CG Power | 112x | 27.6% | 13.3% | ₹1.06 Lakh Cr |
| QPower | 93x | 23.2% | 19.4% | ₹6,260 Cr |
QPower’s valuation rivals industry giants without scale. It’s the small cap with mega-cap hopes.
11. 🧪 Miscellaneous – Shareholding, Promoters
| Holder | Stake |
|---|---|
| Promoters | 73.91% ✅ |
| FIIs | 3.99% |
| DIIs | 8.76% |
| Public | 13.35% |
| No. of Shareholders | 81,106 |
Strong promoter skin in the game. Institutions starting to nibble.
12. 🎭 EduInvesting Verdict™
What we like:
- 🔋 Clean balance sheet
- 📈 80% PAT growth in FY25
- 🌍 Acquisitions = global footprint strategy
- 🏭 ₹750 Cr capex shows ambition
What we don’t:
- 🚨 93x P/E with only ₹337 Cr sales?
- ⚠️ Working capital stress + debtor pile-up
- 🧮 Other income dominance in PAT
Verdict: Looks like Tesla, but runs on transformer oil. Enjoy the rally, but don’t forget your grounding wire.
FV Range = ₹480 – ₹650 based on core EPS growth + realistic P/E range.
✍️ Written by Prashant | 📅 July 11, 2025
SEO Tags: Quality Power Electrical Equipments Ltd stock analysis, QPower share price target 2025, QPower vs ABB, Mehru acquisition, BSE SME breakout stocks, Indian power equipment stocks, undervalued capex stocks, energy transition India


