✅ At a Glance
Metric | FY24 | FY25 | Change |
---|---|---|---|
Revenue (Ops) | ₹13,520 Cr | ₹14,051 Cr | 🔼 +3.9% |
Total Income | ₹14,845 Cr | ₹15,752 Cr | 🔼 +6.1% |
Net Profit | ₹3,380 Cr | ₹2,508 Cr | 🔽 -25.8% |
EPS | ₹6.14 | ₹4.55 | 🔽 -26% |
CMP (19 May) | ₹147.10 | – | – |
P/E | ~32.3x | TTM basis |
The sun is shining, but so is the debt meter. Profits are real, but interest payments are even realer.
🔋 About ACME Solar Holdings Ltd
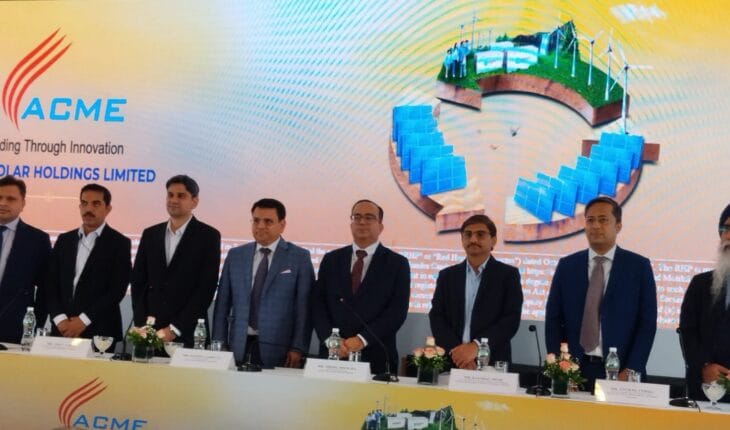
ACME Solar is one of India’s largest independent renewable power producers, primarily focused on solar power generation. It owns and operates solar plants across multiple Indian states and is known for mega-projects.
This is not your average rooftop panel startup. It’s utility-scale solar, full of subsidies, PPAs, and monster capex.
👨🔧 Key Financials FY25 (Consolidated)
Item | ₹ Cr |
---|---|
Revenue from Ops | ₹14,051 Cr |
Other Income | ₹1,701 Cr |
Total Income | ₹15,752 Cr |
Total Expenses | ₹12,162 Cr |
Finance Costs | ₹7,592 Cr |
Depreciation | ₹2,873 Cr |
PBT | ₹3,380 Cr |
PAT | ₹2,508 Cr |
EPS | ₹4.55 |
➡️ 48% of revenue wiped by finance costs.
➡️ Interest + depreciation = more than revenue.
➡️ This is how infra works: debt-fueled profits with long paybacks.
🧮 Forward Value (FV) Estimate
- EPS (TTM) = ₹4.55
- Reasonable P/E for infra renewables = 25x
👉 FV = ₹4.55 × 25 = ₹113.75
CMP = ₹147.10
➡️ Overvalued by ~29.3%
Investors are pricing in solar dreams. But reality = massive interest bills.
🏦 Balance Sheet Snapshot
Item | ₹ Cr |
---|---|
Equity | ₹45,093 Cr |
Total Assets | ₹1,84,037 Cr |
Net Worth | ₹45,093 Cr |
Borrowings (Non-current) | ₹98,572 Cr |
Cash + Bank | ₹12,843 Cr |
Reserves | ₹43,895 Cr |
Debt-to-Equity | 2.18x |
⚠️ This is a highly leveraged infra business. One missed PPA or subsidy delay = chaos.
💸 Cash Flow
Item | ₹ Cr |
---|---|
CFO | ₹15,430 Cr |
Capex | ₹32,660 Cr |
FCF | -₹17,230 Cr ❌ |
Borrowings Raised | ₹66,528 Cr |
Borrowings Repaid | ₹45,139 Cr |
Net Increase in Cash | ₹9,751 Cr |
🎯 This is a borrow-invest-borrow-repeat model. Cash flow to equity = minimal.
🚩 Red Flags & Watchpoints
- 🚨 Finance cost = ₹7,592 Cr
- 💥 Capex = ₹32,660 Cr
- 🔄 Free cash flow negative
- 💣 EPS down 26% YoY
- 🏗️ Projects in pipeline → payback in 10–12 years
- ⚖️ High exposure to DISCOM payment cycles
🧠 EduInvesting Take
“ACME Solar is a giant panel farm running on borrowed sunlight.”
Yes, the profits are real. So is the engineering. But don’t get blinded by the clean energy buzz.
This company is a solar sovereign fund with 2x leverage.
Good for infra bulls. Risky for short-term thrill-seekers.
🏁 Verdict
✔️ Infra scale.
✔️ Solid revenue.
✔️ Sectoral tailwinds.
❌ High debt
❌ EPS compression
❌ Overvalued for now
“This isn’t a multibagger. It’s a power bond in disguise.”
Hold if you’re in. Avoid fresh entries unless below ₹120 or unless EPS rises again.
Tags: ACME Solar FY25 results, renewable infra stock, solar energy India, EPS 4.55, power sector India, high debt infra stocks, EduInvesting infra coverage