1. 🧠 At a Glance
Macrotech Developers (aka Lodha) has quietly turned into one of India’s largest real estate giants, with ₹13,780 Cr in FY25 revenue and ₹2,767 Cr profit. From affordable homes to luxury towers, they’ve got it all — and a PE of 50 to prove it. But with slowing sales growth and promoter dilution, the question is: bullish growth story or overpriced brochure?
2. 🎬 Introduction with Hook
Picture this:
- You’re in Mumbai.
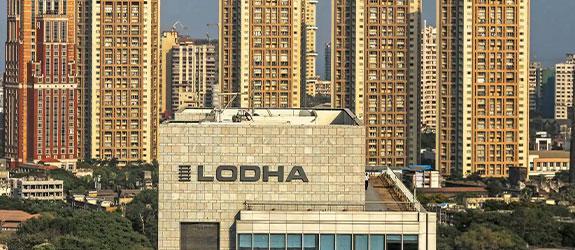
- You see a hoarding with “Lodha” in gold.
- You’re either near a skyscraper, a legal notice, or both.
Welcome to Macrotech Developers — the real estate juggernaut that’s gone from luxury towers in Lower Parel to affordable housing in Dombivli.
But in a business infamous for shady books and shady-er builders, Lodha has IPO’d, deleveraged, expanded pan-India, AND hit ₹1.4 lakh Cr market cap. Sounds too good?
Let’s investigate. 🕵️
3. 🏭 Business Model (WTF Do They Even Do?)
Macrotech is all about real estate development:
- 🏙️ Residential: Luxury (World Towers), premium, and affordable (Casa brand)
- 🏢 Commercial: Office spaces + leasing (Palava, Wadala, Thane)
- 🚧 JDA Projects: Asset-light, JV-based development across MMR + Pune
- 🌆 Rental + Annuitised Projects: Under expansion in Mumbai
Region-wise exposure:
- MMR (Mumbai) – ~70% of presales
- Pune – 15%
- Bengaluru – entered in FY24
- UK Projects (London) – winding down (finally)
They also run digital infra subsidiaries, have acquired logistics firms, and are building a rental income portfolio — because just selling houses is soooo 2010s.
4. 💰 Financials Overview – Profit, Margins, ROE, Growth
| Metric | FY21 | FY23 | FY25 | CAGR |
|---|---|---|---|---|
| Revenue (₹ Cr) | 5,449 | 9,470 | 13,780 | 35% (3Y CAGR) |
| Net Profit (₹ Cr) | 48 | 490 | 2,767 | 154% (3Y CAGR) |
| ROE | 0.5% | 5.0% | 14.7% | |
| OPM | 25% | 22% | 29% | |
| EPS | ₹0.51 | ₹5.05 | ₹27.71 |
✅ Massive profit growth post-COVID
✅ Margins up 700 bps in 2 years
📉 Sales CAGR (5Y) only 2% — projects bunched cyclically
5. 📊 Valuation – Is It Cheap, Meh, or Crack?
| Metric | Value |
|---|---|
| CMP | ₹1,400 |
| Market Cap | ₹1.40 Lakh Cr |
| EPS (TTM) | ₹27.7 |
| PE | ~50.6x |
| Book Value | ₹202 |
| P/B | 6.9x |
| Dividend Yield | 0.30% |
🏗️ Fair Value Range (EduCalc™)
Assuming a 20–25x PE on FY26E EPS of ₹32–₹35:
FV Range = ₹640 – ₹875
At ₹1,400, you’re buying hope, growth, and a little bit of Lodha family PR.
6. 🍿 What’s Cooking – News, Triggers, Drama
- 🧾 London exit: Completed asset sales, capital released
- 💼 Acquisitions: Janus Logistics, Opexefi, One Box
- 🏗️ Merger of 3 infra subsidiaries into mainco
- 👨⚖️ Stamp duty case settled
- 😵💫 Forgery case + PAN misuse incident filed in FY25
- 🏙️ Expanded into Bengaluru (new geography)
Key future trigger:
Massive ₹20,000 Cr+ pipeline across Mumbai suburbs, aimed at pre-sales + rental monetization by FY27.
7. 🧾 Balance Sheet – How Much Debt, How Many Dreams?
| FY25 Key Metrics | Value |
|---|---|
| Net Worth | ₹20,178 Cr |
| Debt | ₹7,094 Cr |
| D/E | 0.35x (down from 1.5x in FY21) |
| Cash Reserves | ₹3,000+ Cr est. |
| Total Assets | ₹49,841 Cr |
✅ Healthy deleveraging
✅ Capital-light JDA model scaling
📉 Promoters sold 10.3% over 3 years
8. 💵 Cash Flow – Sab Number Game Hai
| Year | CFO | CFI | CFF | Net |
|---|---|---|---|---|
| FY23 | ₹2,750 Cr | -₹3,706 Cr | ₹951 Cr | ₹516 Cr |
| FY24 | ₹2,512 Cr | -₹2,947 Cr | -₹403 Cr | -₹838 Cr |
| FY25 | ₹1,566 Cr | -₹90 Cr | -₹2,506 Cr | -₹1,030 Cr |
CFO slowing a bit, major capex and repayments underway.
FY25 saw financing outflow — possibly share buybacks or debt payoff.
9. 📐 Ratios – Sexy or Stressy?
| Ratio | FY23 | FY24 | FY25 |
|---|---|---|---|
| ROE | 5.0% | 15.6% | 14.7% |
| ROCE | 9% | 11% | 15.6% |
| OPM | 22% | 26% | 29% |
| Debtor Days | 28 | 28 | 21 |
| CCC | ~28 days | ~1,500 days 😵💫 | Needs cleanup |
✅ Ratios trending right
❌ Cash Conversion Cycle still a hot mess
But hey, it’s real estate — you get paid when the buyer signs, not when he moves in.
10. 📊 P&L Breakdown – Show Me the Money
| FY25 (₹ Cr) | Value |
|---|---|
| Revenue | ₹13,780 |
| EBITDA | ₹3,987 |
| EBITDA Margin | 29% |
| Interest | ₹550 |
| Depreciation | ₹272 |
| PBT | ₹3,556 |
| Net Profit | ₹2,767 |
P&L looking healthy AF. FY25 is Lodha’s cleanest, sharpest profit cycle in years.
11. 🧢 Peer Comparison – Who Else in the Game?
| Company | PE | ROE | OPM | Mcap (₹ Cr) |
|---|---|---|---|---|
| Lodha | 50.6x | 14.7% | 29% | ₹1.40 L Cr |
| DLF | 44x | 11.1% | 26% | ₹2.02 L Cr |
| Oberoi | 30.8x | 14.7% | 58% | ₹66,752 Cr |
| Godrej Prop | 54.7x | 8.9% | -1.5% | ₹66,496 Cr |
| Phoenix Mills | 54.5x | 9.8% | 56.7% | ₹53,235 Cr |
🏆 Lodha wins on ROCE and profits, but lags Oberoi on margin quality.
12. 🧬 Miscellaneous – Shareholding, Promoters
| Category | Jun ’22 | Mar ’25 |
|---|---|---|
| Promoter | 82.2% | 71.94% (↓ 10.3%) |
| FII | 14.5% | 24.64% (↑🔥) |
| DII | 1.9% | 2.36% |
| Public | 1.4% | 1.04% |
| Shareholders | 53k → 1.04 lakh+ |
🔄 Promoter selling + FII buying
🧠 Public still under 2% – no froth, yet
13. 🧑⚖️ EduInvesting Verdict™
✅ Real estate’s cleanest balance sheet
✅ Strongest profit growth cycle since IPO
✅ Lower debt, rising ROE, expansion across cities
BUT…
❌ Valuation assumes this momentum sustains till FY28
❌ Promoter selling + legal cases = watch your back
❌ Execution delays can derail margins
Verdict:
This isn’t your average builder stock. This is Ambani meets Cementwala energy — except the PE ratio also thinks it’s Amazon.
If you’re okay paying 50x for floor space, go ahead. Just make sure you don’t get stuck in the lift on the way up.
✍️ Written by Prashant | 📅 July 12, 2025
Tags: Lodha Developers, Macrotech, Real Estate Stocks, Mumbai Builders, IPO, ROE, Pre-sales, EduInvesting


