At a Glance
Insolation Energy Ltd (BSE: 543620) is Jaipur’s solar overachiever with a 3 GW dream, 109% profit CAGR, and a 50% ROE that makes Adani Green look shy. From making panels to owning power plants, it wants to be India’s vertically integrated solar beast — but is the valuation already on steroids?
1. 🎬 Hook — From Panels to Power Plants, This Is Not Your Usual SME
India’s #2 North-based solar panel maker is no longer just an SME story.
It’s now:
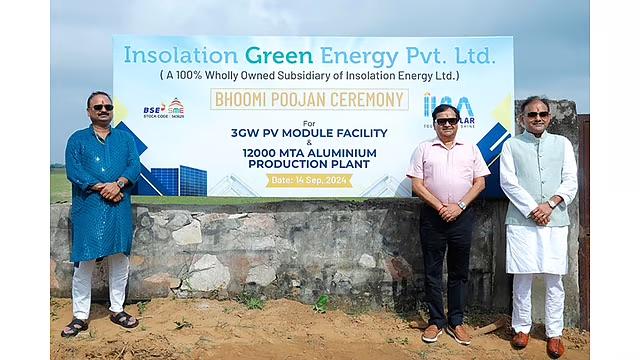
- ⚙️ Planning a 3 GW solar module and solar cell factory
- 💰 Just did ₹1,334 Cr in FY25 revenue (up 81%)
- 💡 Bagging massive orders — ₹380 Cr + ₹733 Cr in the last quarter
- 🚨 Faced double CFO & CEO resignations in March 2025 👀
With a ₹5,700 Cr market cap and razor-sharp 56% ROCE, Insolation is aiming for the sun — but flying too close can burn you.
2. 🛠️ WTF Do They Even Do?
☀️ Core Business:
- Manufactures Solar PV Modules (200 MW capacity currently)
- Now expanding to Solar Cell manufacturing (in-house backward integration)
🧱 Subsidiaries and Projects:
- Insolation Green Energy Pvt Ltd: Solar EPC + project dev
- MGVI Green Infra Three Pvt Ltd: 60% owned SPV for solar projects
- ₹250 Cr pumped into WOS for vertical scale-up
🔌 Business Model Transition:
From OEM → OEM + EPC → OEM + EPC + IPP (Independent Power Producer)
Total shift from “component supplier” to full-stack solar utility. 🤯
3. 💰 Financials – Revenue Exploding Like Rajasthan Heat
| Metric | FY21 | FY22 | FY23 | FY24 | FY25 |
|---|---|---|---|---|---|
| Revenue (₹ Cr) | 163 | 215 | 259 | 229 | 1,270 🔥 |
| Net Profit (₹ Cr) | 7 | 7 | 6 | 3 | 122 🧨 |
| OPM (%) | 8% | 6% | 5% | 2% | 13% 🌞 |
| ROE (%) | 40% | 28% | 16% | 8% | 49.9% |
| EPS | ₹0.46 | ₹0.30 | ₹0.14 | ₹5.53 |
⚡ TTM profit up 43X
📈 Margins back after years of stress
🔥 FY25 alone added ₹1,000 Cr in revenue
4. 💸 Valuation – Premium-Priced or Power-Backed?
- CMP = ₹261
- EPS (FY25) = ₹5.53
- P/E = 47.1x
- Book Value = ₹19.9
- P/B = 13.12x
- Market Cap = ₹5,749 Cr
Fair Value Range (EduCalc™)
- Assuming FY26 EPS = ₹7–8
- Assigning 28x–35x P/E (peer avg for solar manufacturers)
- FV = ₹196 – ₹280
🧠 Verdict: CMP bakes in most of the FY25 growth
Future rerating depends on cell capacity execution + no more CFO exits please
5. 🍳 What’s Cooking — Orders, O&M, and Capex Crack
🛠️ Expansion Alert:
- ₹1,300 Cr capex to launch solar cell manufacturing
- 3 GW solar module and cell line = backward integration
- Ongoing ₹380 Cr solar project order = ₹46 Cr/year for 25 years O&M revenue
📦 Recent Orders:
- ₹733 Cr order in March 2025
- ₹372 Cr LOA bagged
- ₹36 Cr sales order via WOS
🧯 Big risk: Too many subsidiaries, too fast. Hope it’s not Solar Theranos.
6. 🧾 Balance Sheet – Now with Capex Muscle
| Metric | FY25 |
|---|---|
| Equity Capital | ₹22 Cr |
| Reserves | ₹416 Cr |
| Borrowings | ₹24 Cr ✅ |
| Total Assets | ₹483 Cr |
| Debt/Equity | 0.06 ✅ |
| Net Cash from Ops | ₹130 Cr ✅ |
| Net Cash from Investing | -₹210 Cr 🚧 |
✅ Debt-free growth
✅ Massive capex funded from internal accruals
⚠️ Net cash turning negative in FY25 — watch liquidity
7. 💵 Cash Flow – Cash Cow or Capex Hog?
| Year | CFO | Capex | Net Cash |
|---|---|---|---|
| FY23 | -₹20 Cr | -₹0.5 Cr | ₹10 Cr |
| FY24 | ₹14 Cr | -₹1 Cr | ₹8 Cr |
| FY25 | ₹130 Cr | -₹210 Cr | -₹29 Cr |
🟢 Massive operating cash generation in FY25
🔴 But investing cashflow gushing out = plant expansions
EduMemo: Great CFO, bad FCF = growth company vibes
8. 📊 Ratios – ROCE Ka Baap
| Ratio | FY25 |
|---|---|
| ROE | 49.9% ✅ |
| ROCE | 56.6% ✅ |
| OPM | 13% (was 2% last year) |
| Debtor Days | 9 |
| Inventory Days | 8 |
| Payable Days | 5 |
| CCC | 12 🔥 |
| Working Capital Days | 13 ✅ |
📦 Working capital cycle optimized to perfection
💥 Return ratios scream capital efficiency
9. 📉 P&L Breakdown – Turnaround 101
- FY24 was the “clean-up” year with just ₹3 Cr PAT
- FY25 saw that jump 40x — thanks to order wins and operating leverage
- Margins returned to 13%, EBITDA went from ₹4 Cr to ₹160 Cr
This is what a scale-up looks like when it works. Now, they need to defend those numbers.
10. 🆚 Peer Comparison – Solar Mafia Rankings
| Company | P/E | ROE | OPM | PAT (₹ Cr) |
|---|---|---|---|---|
| Adani Green | 97x | 14.6% | 79.3% | ₹1,664 Cr |
| JSW Energy | 50x | 7.4% | 44.5% | ₹1,785 Cr |
| NTPC Green | 189x | 3.8% | 86.7% | ₹474 Cr |
| Insolation | 47x | 49.9% | 13% | ₹122 Cr |
✅ ROE King
✅ Best CCC and lowest debt
🚨 But scale mismatch vs biggies + valuation is high
11. 🧩 Miscellaneous – Promoter Moves & Public Madness
- Promoters: 66.01% (was 70% last year) ❌
- FIIs: 0.94% (up from 0.06%) ✅
- DIIs: 0.42% ✅
- Public: 32.6%
- Shareholders: 1,400 → 5,200+ in 12 months 👀
📉 Promoter stake fell 3.7% last quarter
🤯 Retail surge = volatility risk
⚠️ No dividend payout yet despite ₹122 Cr PAT
12. 🚧 Risks — What Could Go Wrong?
- 🧯 Key management exits (CEO + CFO in Mar 2025) = 🚨
- 🧱 ₹1,300 Cr capex = big bet for smallcap
- ⚡ Solar panel prices are volatile = margin compression risk
- 🔍 Lack of history — listed only since 2022
- ❌ No dividend, no buyback, no yield
13. 🧑⚖️ EduInvesting Verdict™
Insolation Energy is Jaipur’s answer to Adani Green — except with working capital discipline, no crazy debt, and actual solar factories.
- ✅ ROE/ROCE 🔥
- ✅ 81% topline growth
- ✅ Full-stack solar play
- 🚨 CMP pricing in perfection
- 🚨 CEO + CFO exit = not ideal when you’re planning ₹1,300 Cr capex
Final Word: Insolation is the solar stock that makes your SIP look slow. But remember — the sun can blind you too.
✍️ Written by Prashant | 📅 July 6, 2025
Tags: Insolation Energy, Solar SME Stock, Solar Cell Manufacturing India, Renewable Energy, Smallcap Solar, EduInvesting, Infra Stocks, ROE Kings, BSE SME Growth Stocks, Solar Panel India


