1. 🧠 At a Glance
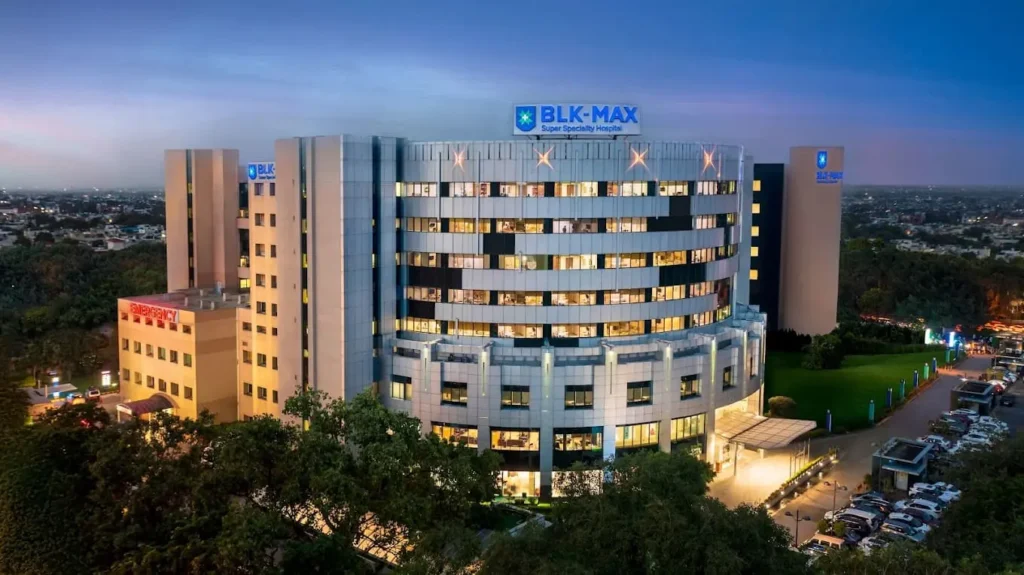
Max Healthcare is India’s second-largest hospital chain by revenue and EBITDA, with operations across Delhi-NCR, Mumbai, and North India. It’s growing fast, printing strong profits, and operating at ~27% margins. But with a PE of 105, and promoter holding down to 23.7%, the stock feels like it needs an ICU — for its valuation.
2. 🎬 Introduction with Hook
Imagine charging ₹5,000 for an MRI and still not being able to explain to the patient why the doctor hasn’t arrived. That’s healthcare in India.
But Max Healthcare figured out how to do it profitably — without being government-run or doctor-led. With its IPO, aggressive expansion, margin control, and EBITDA of ₹1,849 Cr in FY25, Max now sits pretty at a ₹1.18 lakh Cr market cap.
The problem? The stock is priced like it’s curing cancer every quarter.
3. 🏭 Business Model (WTF Do They Even Do?)
Max runs a hospital-centric business model:
- 🏥 17+ Hospitals
- 🧪 4,000+ operational beds
- ⚕️ Strong focus on oncology, cardiology, orthopaedics, transplants
- 💼 Mix of owned hospitals, leased assets, and operated centers
- 📈 ~80% of revenue comes from 4-5 flagship locations (Delhi NCR = cash cow)
Plus:
- Max Lab diagnostics (vertical integration)
- Day-care centres, pathology, and medical tourism (~12–14% of revenue)
- Pan-India Expansion: Focused mostly on urban Tier-1
4. 💰 Financials Overview – Profit, Margins, ROE, Growth
| Metric | FY21 | FY23 | FY25 | CAGR |
|---|---|---|---|---|
| Revenue (₹ Cr) | 2,508 | 4,563 | 7,028 | ~30% (5Y) |
| Net Profit (₹ Cr) | -138 | 1,104 | 1,076 | Turnaround story ✅ |
| OPM | 16% | 27% | 26% | |
| ROE | -1.4% | 11.4% | 12.7% |
✅ Profit compounding at 64% CAGR (5Y)
✅ Consistent margin improvement
📉 But ROE/ROCE still modest
5. 📊 Valuation – Is It Cheap, Meh, or Crack?
| Metric | Value |
|---|---|
| CMP | ₹1,219 |
| Market Cap | ₹1.18 Lakh Cr |
| EPS (TTM) | ₹11.07 |
| PE | ~105x |
| P/B | 12.6x |
| Dividend Yield | 0.12% |
📉 PE = nosebleed
💰 Hospital sector is asset-heavy — so 100x PE = insane expectations
🧮 Fair Value Range (EduCalc™)
Assuming 35–40x PE on FY26E EPS of ₹14–₹15:
FV Range = ₹490 – ₹600
You’re paying future growth + optimism + ESG bonus + ICU room charges all rolled into one.
6. 🍿 What’s Cooking – News, Triggers, Drama
- 🏥 New hospitals under construction (1,000+ beds planned)
- 🩺 Focus on expanding Max Lab, day-care surgeries
- 💼 Acquired assets from Radiant, Saket City Hospitals
- 📊 Final dividend ₹1.50/share declared (meh)
- 🔃 Share transfer of Sandhya Hydro Power to promoters
- 📉 Promoters have reduced stake from 50% to 23.7% in 3 years
- 📦 Jump in borrowing to ₹3,000 Cr in FY25 (from ₹1,300 Cr FY24)
7. 🧾 Balance Sheet – How Much Debt, How Many Dreams?
| FY25 Key Metrics | Value |
|---|---|
| Net Worth | ₹9,381 Cr |
| Total Borrowings | ₹3,010 Cr |
| Debt/Equity | 0.32x |
| Total Assets | ₹15,186 Cr |
| CWIP | ₹901 Cr (new hospitals incoming) |
Solid balance sheet, minimal gearing, but increasing capex commitments ahead.
8. 💵 Cash Flow – Sab Number Game Hai
| Year | CFO | CFI | CFF | Net |
|---|---|---|---|---|
| FY23 | ₹1,284 Cr | -₹102 Cr | -₹289 Cr | ₹893 Cr |
| FY24 | ₹1,122 Cr | -₹1,253 Cr | -₹264 Cr | -₹395 Cr |
| FY25 | ₹1,459 Cr | -₹1,614 Cr | -₹164 Cr | -₹319 Cr |
🔥 Operating cash flows are robust
⚠️ Investing cash flow (capex) jumped big
📉 Free cash flow turning negative — expansion is expensive
9. 📐 Ratios – Sexy or Stressy?
| Ratio | FY23 | FY24 | FY25 |
|---|---|---|---|
| ROE | 11.4% | 13% | 12.7% |
| ROCE | 15% | 16% | 14.9% |
| OPM | 27% | 28% | 26% |
| Working Capital Days | -39 | -36 | -34 |
| CCC | -158 days | -149 | -138 |
✅ Negative working capital (patients pay first!)
✅ ROE stable but not mind-blowing
❌ Valuation doesn’t justify these ratios
10. 📊 P&L Breakdown – Show Me the Money
| FY25 (₹ Cr) | Value |
|---|---|
| Revenue | ₹7,028 |
| EBITDA | ₹1,849 |
| EBITDA Margin | 26.3% |
| Interest | ₹165 |
| Depreciation | ₹359 |
| PBT | ₹1,406 |
| Net Profit | ₹1,076 |
| Net Profit Margin | 15.3% |
Operating leverage is working — hospital fixed cost model, high bed occupancy driving margins.
11. 🧢 Peer Comparison – Who Else in the Game?
| Company | PE | ROE | OPM | Mcap (₹ Cr) |
|---|---|---|---|---|
| Max | 105x | 12.7% | 26% | ₹1.18L Cr |
| Apollo | 71x | 19% | 14% | ₹1.03L Cr |
| Fortis | 68x | 10.2% | 20% | ₹57.7k Cr |
| Narayana | 51x | 24.5% | 23% | ₹41k Cr |
| Medanta (Global Health) | 67x | 16.5% | 24% | ₹35k Cr |
Max is most expensive, and not the most efficient.
12. 🧬 Miscellaneous – Shareholding, Promoters
| Category | Jun ’22 | Mar ’25 |
|---|---|---|
| Promoters | 50.64% | 23.74% (↓ big-time) |
| FII | 23.3% → 54.7% | |
| DII | 19.4% → 17.6% | |
| Public | 6.6% → 3.9% |
📉 Promoter exits +
📈 FII party going strong
The institutions clearly love this — whether for ESG score, defensive growth, or AI can’t explain it either.
13. 🧑⚖️ EduInvesting Verdict™
✅ Best-in-class margins
✅ Strong network, cash flows, and brand recall
✅ Clean books, solid growth history
BUT…
❌ Insanely expensive stock
❌ Promoters checked out
❌ All future growth seems already priced in
Verdict:
Max Healthcare isn’t a stock — it’s a private ward for rich FIIs. You’re not buying EBITDA. You’re buying a future where ICU charges rise faster than inflation — and Max bills you for the dream.
If Apollo is the Tata, Max is the Uber Surge version.
✍️ Written by Prashant | 📅 July 12, 2025
Tags: Max Healthcare, Hospital Stocks, Healthcare Sector, PE Ratio, Delhi NCR Hospitals, Max Labs, EduInvesting, FII Holding, High Valuation


