Tejas Cargo India Limited H1 FY26 – ₹301 Cr Quarterly Sales, 43.6% Profit Jump & a 1,131-Truck Midlife Crisis
1. At a Glance – Blink and You’ll Miss the Truck
₹681 crore market cap. ₹285 stock price. ROE of 16.7%. ROCE of 15.6%. Debt of ₹180 crore staring straight at equity like a long-haul driver on his fifth espresso. Tejas Cargo India Limited is what happens when India’s highway economy decides to put on a spreadsheet and go public. The company reported ₹301 crore quarterly sales, ₹12.6 crore quarterly PAT, and a 43.6% jump in quarterly profits, which is impressive for a firm that was incorporated in 2021 and already behaves like a logistics veteran with back pain.
The stock has delivered 38.4% returns over six months, then calmly reversed with a -3.7% return over three months, because consistency is overrated. With 1,131 vehicles, an average fleet age of 2.88 years, and promoters holding 74.27%, this is not a fly-by-night operator. This is a fly-by-night operator with GPS, IoT, and a half-yearly earnings call.
But is Tejas Cargo a lean logistics machine or just a capital-intensive truck parade funded by optimism and EMIs? Let’s open the bonnet.
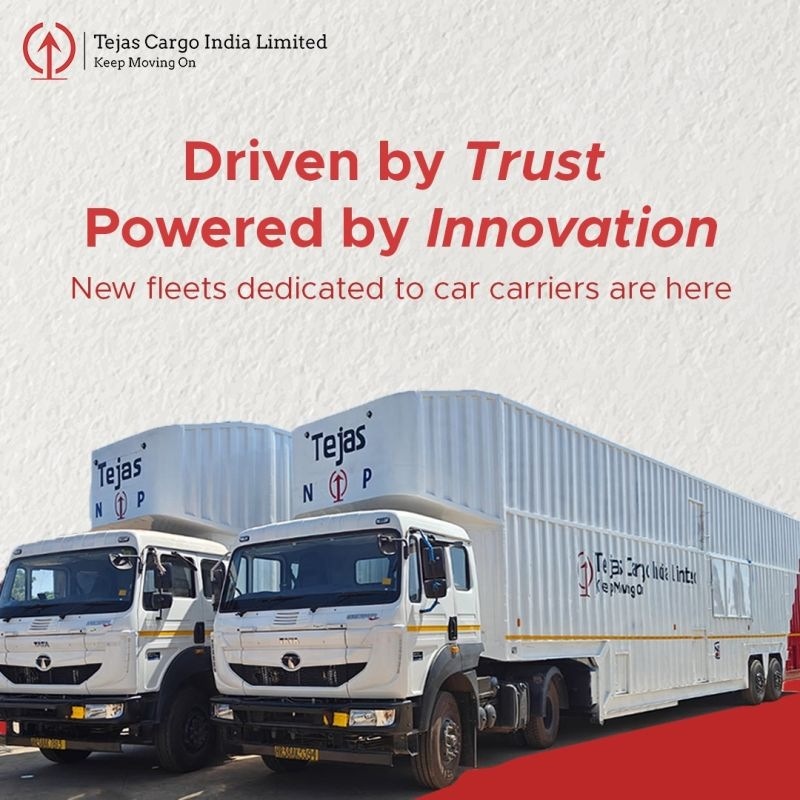
2. Introduction – From Faridabad to Everywhere, Slowly and Loudly
Tejas Cargo India Limited was incorporated in March 2021, which means it was born during peak uncertainty and decided, “Perfect time to buy trucks.” Based out of Faridabad, Haryana, the company focuses on long-haul Full Truck Load (FTL) road transportation across India. No fancy last-mile experiments, no drone deliveries, no same-day unicorn fantasies. Just trucks, highways, toll booths, and diesel bills.
The company services multiple sectors: logistics aggregators, steel & cement, e-commerce, industrial & chemicals, FMCG, and white goods. Basically, if it needs to move in bulk and doesn’t care about vibes, Tejas will carry it.
What makes Tejas interesting is not just growth, but speed. In FY24, it completed 98,913 trips, moved 11.94 lakh tonnes of goods, and improved its on-time delivery rate to 78.13% from 72.38%. That’s not Amazon-level, but in Indian long-haul logistics, that’s respectable enough to brag about in investor presentations.
And yes, it went public in February 2025, raising ₹106 crore, because nothing says confidence like listing while still expanding your fleet and business model simultaneously.
Question for you: would you trust a three-year-old company with over a thousand trucks? Or is that exactly how scale is built in India?
3. Business Model – WTF Do They Even Do?
Tejas Cargo is a pure-play FTL road logistics company. No partial loads, no courier drama, no “sir parcel kidhar hai” calls every five minutes. If you need an entire truck from Point A to Point B, Tejas shows up with a spreadsheet and a steering wheel.
Their operations are divided into three models:
Own Fleet to Clients – Trucks owned by Tejas, deployed directly for customer contracts. This contributed 60.04% of FY24 revenue. High control, high capex, high EMI energy.
Own Fleet to Open Market – Trucks hired out in the open market. Only 4.69% of revenue, which tells you they’re not Uber for trucks.
Market Fleet to Clients – Third-party trucks hired to fulfill contracts. 35.27% of revenue, and quietly the most scalable part of the business.
This mix matters because Tejas is transitioning to a hybrid model, integrating leased vehicles alongside owned ones. The stated goal is lower capital expenditure, better flexibility, and optimized costs. Translation: “Trucks are expensive, depreciation hurts, let’s rent some.”
The company also offers route optimization, fleet selection, documentation, compliance, and real-time IoT-enabled tracking, which is corporate speak for “we know where your truck is stuck.”
Is this exciting? No. Is it essential? Absolutely. Logistics is the plumbing of the economy. Nobody claps for pipes, but everyone panics when they leak.
4. Financials Overview – Numbers That Actually Move