1. At a Glance
Stylam is not just any panel peddler—it’s the largest laminate-producing group in India with world-first technology like PU+ lacquer coatings. But behind the glossy surfaces lie thin margins, high valuations, and growth that’s now being stress-tested in a world where discretionary spending is flaking.
2. Introduction with Hook
If laminates were fashion, Stylam would be the Gucci of glossy surfaces—highly engineered, highly aesthetic, and highly export-oriented.
- ROCE? A sizzling 27.4%—borderline illegal levels of efficiency.
- EPS? ₹71.88 in FY25, but down from ₹75.76 in FY24. Trouble in paradise?
With exports to Europe, Southeast Asia, and a tech moat in hot PU+ coatings, Stylam has led the pack. But growth has slowed, and the share price is down 14% YoY. Is this a pause or the start of a fade?
3. Business Model (WTF Do They Even Do?)
Stylam is in the business of turning MDF into magic. They manufacture:
- Decorative laminates (core biz)
- Solid acrylic surfaces
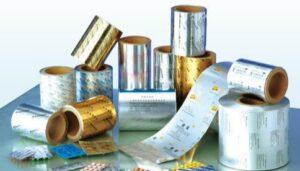
- PU+ lacquer coated specialty laminates
- Compact & exterior laminates
90%+ of revenue comes from exports, with a strong presence in Europe, Middle East, and Southeast Asia. In short, they sell India’s walls to the world.
They’ve pioneered the Hot Coating Process in India—basically the beauty filter for laminates. Oh, and their margins are as slick as their surfaces.
4. Financials Overview
| Year | Revenue (₹ Cr) | EBITDA (₹ Cr) | PAT (₹ Cr) | EPS (₹) | ROCE (%) | ROE (%) |
|---|---|---|---|---|---|---|
| FY21 | 480 | 99 | 55 | 32.72 | 24% | 20% |
| FY22 | 659 | 104 | 61 | 36.00 | 25% | 20% |
| FY23 | 952 | 155 | 96 | 56.61 | 32% | 23% |
| FY24 | 914 | 183 | 128 | 75.76 | 33% | 24% |
| FY25 | 1,025 | 185 | 122 | 71.88 | 27% | 20% |
Key Insight: Revenue up, profits up… but now growth is stalling, and EPS has begun to decline.
5. Valuation
- CMP: ₹1,713
- EPS (FY25): ₹71.88
- P/E: ~24x
- Book Value: ₹388 → P/B: 4.4x
Valuation Multiples Approach:
- Laminates industry average P/E: 30–35x
- Fair Value Range based on 20–28x EPS of ₹72 = ₹1,440 to ₹2,000
EduVerdict: Fair value band of ₹1,450–2,000. CMP is mid-range. No multibagger here… unless they pull out a plywood rabbit from their capex hat.
6. What’s Cooking – News, Triggers, Drama
- New plant in Panchkula to begin operations by Oct 2025. Capacity addition could revive volume growth.
- Share transfer lawsuit: Minor noise—court stayed transfer of 4.55% shares.
- Promoter holding dropped from 54.6% to 52.2% in FY25. Why the exit?
- Exports remain vulnerable to global slowdowns.
Short-term triggers:
- New plant scaling
- Court resolution
- Any blockbuster design/brand launch
7. Balance Sheet
| Particulars (₹ Cr) | FY21 | FY22 | FY23 | FY24 | FY25 |
|---|---|---|---|---|---|
| Equity Capital | 8 | 8 | 8 | 8 | 8 |
| Reserves | 251 | 308 | 404 | 528 | 649 |
| Borrowings | 59 | 79 | 47 | 1 | 36 |
| Total Liabilities | 407 | 489 | 538 | 608 | 779 |
| Fixed Assets | 188 | 179 | 172 | 175 | 177 |
| CWIP | 0 | 0 | 13 | 2 | 83 |
Callout: Almost debt-free and reserves growing at 20%+ CAGR. Massive CWIP (₹83 Cr) hints at large expansion cooking.
8. Cash Flow – Sab Number Game Hai
| Year | CFO | CFI | CFF | Net Cash |
|---|---|---|---|---|
| FY21 | ₹79 | ₹-6 | ₹-64 | ₹9 |
| FY22 | ₹6 | ₹-30 | ₹17 | ₹-7 |
| FY23 | ₹66 | ₹-12 | ₹-36 | ₹18 |
| FY24 | ₹113 | ₹-21 | ₹-47 | ₹45 |
| FY25 | ₹107 | ₹-126 | ₹-4 | ₹-23 |
Translation:
FY25 = cash from ops positive but capex is guzzling the cash. Net cash flow turned negative.
9. Ratios – Sexy or Stressy?
| Metric | FY23 | FY24 | FY25 |
|---|---|---|---|
| ROE (%) | 23% | 24% | 20% |
| ROCE (%) | 32% | 33% | 27% |
| OPM (%) | 16% | 20% | 18% |
| Debtor Days | 48 | 65 | 73 |
| Inventory Days | 110 | 112 | 121 |
| CCC (Days) | 131 | 147 | 163 |
Conclusion:
Core ratios are industry-beating, but working capital is stretching. Stylam may be stylish, but it needs to tighten inventory and collections to keep up.
10. P&L Breakdown – Show Me the Money
| FY | Sales | EBITDA | OI | PAT |
|---|---|---|---|---|
| FY23 | 952 | 155 | 1 | 96 |
| FY24 | 914 | 183 | 6 | 128 |
| FY25 | 1,025 | 185 | 7 | 122 |
Margins are stable, but FY25 has slowed—sales growth of just 12%, and PAT actually declined despite higher sales.
11. Peer Comparison
| Company | P/E | ROE (%) | OPM (%) | Sales (₹ Cr) | PAT (₹ Cr) |
|---|---|---|---|---|---|
| Stylam | 23.9 | 20.4 | 18% | 1,025 | 122 |
| Century Ply | 83.2 | 8.4 | 10.8% | 4,528 | 193 |
| Greenlam | 102.7 | 5.9 | 10.6% | 2,569 | 65 |
| Greenply | 43.7 | 12.1 | 8.2% | 2,488 | 92 |
| Greenpanel | 49.7 | 5.3 | 9.1% | 1,436 | 72 |
Verdict: Stylam is the king of ROE and margins, while others are playing catch-up. Also priced cheaper than its overhyped peers.
12. Miscellaneous – Shareholding, Promoters
- Promoters: 52.19% (down from 54.61% in FY24)
- FIIs + DIIs: 16.3%
- Public: 31.5%
- Shareholders: Grew from 9k (2022) to 34k (2025) = strong retail interest
Concalls and presentations are regular, transparent, and investor-friendly.
13. EduInvesting Verdict™
Stylam is a global leader with desi roots—its product line is top-notch, margins elite, and its export engine revs with innovation. But signs of fatigue are appearing: slowing growth, flattening EPS, and rising working capital.
That said, it’s not every day you get a 27% ROCE business at 24x earnings.
Stylam isn’t just selling laminates—it’s selling margin power. But to remain relevant, it’ll need its new plant to deliver, its working capital to shrink, and its branding to scale up.
Otherwise, it risks becoming just another shiny surface with hollow returns.
Metadata
– Written by EduInvesting Research | 17 July 2025
– Tags: Stylam Industries, Laminates, PU+ Coating, ROCE Leaders, Export Stocks, Capex Expansion, Value Stocks

