1. At a Glance
Stylam Industries Ltd (NSE: STYLAMIND, BSE: 526951) — the company that makes your furniture look richer than your bank balance — has dropped another spicy quarterly show. For Q2 FY26, the Chandigarh-based laminate legend clocked revenue of ₹29,240 crore equivalent lakhs (₹292.4 Cr) and PAT of ₹37.3 Cr, keeping its laminate throne firmly bolted to the floor.
With a market cap of ₹3,356 Cr, stock price ₹1,994, and a P/E ratio of 26.9, Stylam’s numbers are less of a mood swing and more of a methodical march. ROE stands at 20.4% while ROCE hits 27.4% — that’s basically the corporate version of “abs tight, core strong.”
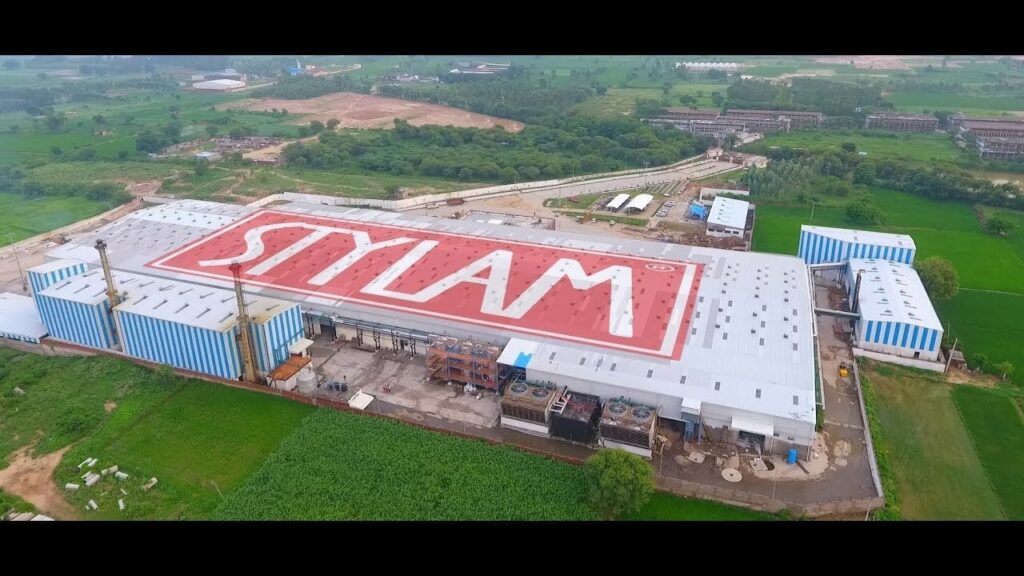
The company is now debt-free (yes, ₹0.00 Cr debt) and expanding faster than a YouTuber’s podcast network. A brand-new ₹200 Cr laminate plant in Panchkula, Haryana, funded entirely through internal accruals, is set to start in Jan 2026.
And in FY24, Stylam’s laminates operated at 74% capacity utilization, meaning there’s still room to push. The domestic business, though smaller, is heating up — the company aims for ₹700 Cr domestic revenue by 2030.
But here’s the hook — 71% of Stylam’s business comes from exports. From Ludhiana to London, Stylam’s decorative sheets are flexing on global furniture.
So yes, your IKEA table might just be low-key wearing a Stylam jacket.
2. Introduction – Laminate Laughter & International Drama
Stylam Industries is not your typical plywood-wala story. While most Indian furniture dreams die at the carpenter’s doorstep, Stylam has been laminating the world one glossy sheet at a time. From PU+ Lacquer-coated sheets to acrylic solid surfaces, they’re basically the “Louis Vuitton of laminates” — except these don’t come with influencers.
In FY22, the company’s revenue stood at ₹659 Cr. By FY24, it flexed to ₹1,095 Cr — a stunning 39% growth in two years. That’s not “slow and steady wins the race.” That’s “fast and stylish overtakes Century Ply in the right lane.”
But the real kicker? Net debt zero. Zero. Nada. Zilch. In a world where most Indian manufacturers treat leverage like butter on paratha, Stylam went full keto.
And now, with the new Panchkula plant ready to add 4.8 million sheets of capacity, Stylam’s expansion feels less like corporate planning and more like Marvel’s Phase 6 — except with resin, not vibranium.
Exports dominate 71% of its revenue in H1 FY25 — from 64% in FY22 — showing the company’s ability to sell “Made in India” surfaces to 80 countries across 2,000+ cities. That’s more than most Bollywood stars’ reach on Instagram.
3. Business Model – WTF Do They Even Do?
Let’s keep it simple: Stylam manufactures decorative laminates — those smooth, shiny sheets that cover your kitchen cabinets, tables, and sometimes your poor financial decisions.
But it doesn’t stop there. The company’s menu of surface glam includes:
- High-Pressure Laminates (HPL) – their bread and butter.
- Performance & Compact Laminates
- – for those who like their tables sturdy.
- PU+ Lacquer Coated Laminates – for the premium crowd.
- Acrylic Solid Surfaces – basically the Tesla of table-tops.
- Specialty Surfaces – for that one architect who insists on matte black everything.
Stylam also does Hot Coating — a global first for PU+ Lacquer coating on thin laminates. That’s not just innovation; it’s laminate swagger.
It exports to over 80 countries — Europe, Southeast Asia, and probably that one villa in Dubai you can’t afford. On the domestic front, it has 300+ distributors and 6,000+ dealers.
They’re now venturing into MDF lamination with short-cycle press capacity — a strategic move to capture the ₹7,000+ Cr MDF market that’s hotter than a Delhi summer.
So in short: they make your furniture fancy, globally. And they do it profitably.
4. Financials Overview
| Metric (₹ Cr) | Q2 FY26 | Q2 FY25 | Q1 FY26 | YoY % | QoQ % |
|---|---|---|---|---|---|
| Revenue | 292 | 263 | 283 | 11.0% | 3.2% |
| EBITDA | 57 | 54 | 53 | 5.5% | 7.5% |
| PAT | 37.3 | 34 | 28 | 9.7% | 33.2% |
| EPS (₹) | 22.0 | 20.1 | 16.7 | 9.4% | 31.7% |
Stylam’s quarterly performance screams consistency with style. Revenue is growing in double digits, margins are steady, and PAT is flexing like it’s been hitting the gym.
Annualised EPS (22 × 4 = ₹88) gives a P/E of ~22.6x vs industry average P/E of 45.2x — meaning Stylam trades at nearly half the bling of peers like Greenlam or Century Ply. That’s not undervaluation; that’s potential energy waiting for kinetic action.
5. Valuation Discussion – Fair Value Range
Let’s crunch some numbers — like an accountant who binge-watches CNBC.
Method 1: P/E Method
Annualised EPS = ₹88
Stylam’s historic P/E range = 20x–35x
Fair Value = ₹1,760 – ₹3,080
Method 2: EV/EBITDA
EV/EBITDA = 16.4x
Industry average = 20x
If Stylam re-rates to 18x → Upside potential ≈ 10–15% range
Method 3: DCF (simplified)
Using FY25 free cash flow of ~₹45 Cr and 12% growth for 5 years → intrinsic range ₹1,850–₹2,900
→ Fair Value Range (Educational Only)
₹1,800 – ₹3,000 per share
Disclaimer: This fair value range is for educational purposes only and not investment

