1. At a Glance
Once a low-profile trader, SG Mart Ltd has now become a ₹4,200 Cr market-cap company with dreams of becoming a construction and renewables behemoth. With a P/E of 40, heavy capex, and a takeover by the APL Apollo family, the stock is under the spotlight. But is the growth organic—or just “Other Income”?
2. Introduction with Hook
Picture this: A quiet kirana shop suddenly starts selling Teslas. That’s SG Mart for you—once barely reporting crores in revenue, and now planning ₹600 Cr in capex, ₹266 Cr in solar mounting orders, and an open offer by APL Apollo-linked promoters.
- EPS grew from ₹5.46 in FY24 to ₹9.20 in FY25
- Sales grew 118% YoY (₹2,683 Cr to ₹5,856 Cr)
- Promoter holding has dropped from 75% to 36.27%
It’s not just a pivot—it’s a reincarnation.
3. Business Model (WTF Do They Even Do?)
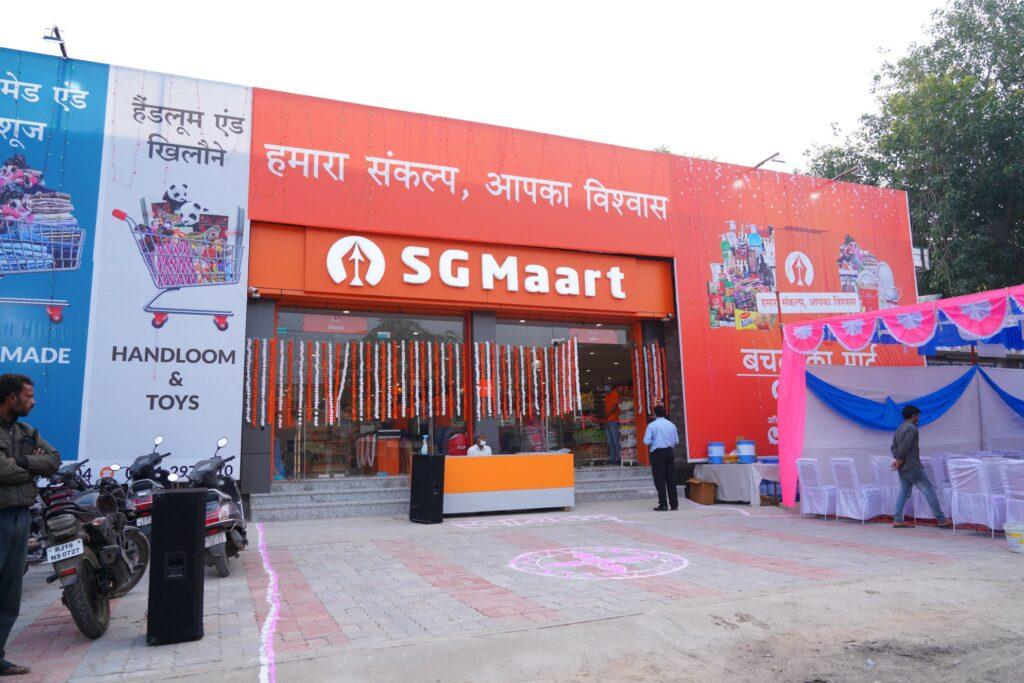
SG Mart is now a B2B/B2C platform selling:
- Construction Products: TMT rebars, HR sheets, barbed wires
- Home Improvement: Tiles, bath fittings, laminates, paints
- Solar Structures: ₹266 Cr order from IPPs for mounting structures
Their model resembles a steel-focused omnichannel infra mart, possibly targeting real estate, MSMEs, and large EPC projects.
Also, with ₹600 Cr capex underway, they plan to ramp capacity from 0.6 Mn Ton to 2.5 Mn Ton by FY27.
4. Financials Overview
| Metric | FY24 | FY25 |
|---|---|---|
| Sales | ₹2,683 Cr | ₹5,856 Cr |
| Operating Profit | ₹62 Cr | ₹103 Cr |
| OPM % | 2.3% | 1.76% |
| Other Income | ₹32 Cr | ₹80 Cr |
| Net Profit | ₹61 Cr | ₹103 Cr |
| EPS | ₹5.46 | ₹9.20 |
Key Flags:
- Margins are wafer-thin (~2%)
- ₹80 Cr “Other Income” is 78% of Net Profit
- No dividend despite profitability
5. Valuation
| Valuation Method | Estimate |
|---|---|
| P/E Method (20–30x EPS ₹9.2) | ₹184–₹276 |
| EV/EBITDA Method (Assuming ₹150 Cr EBITDA FY26) | ₹300–₹350 |
| DCF (Aggressive Capex Story) | ₹350–₹420 |
Fair Value Range: ₹275–₹420
Current Price: ₹375
Verdict: Priced for perfection, running on APL Apollo adrenaline
6. What’s Cooking – News, Triggers, Drama
- APL Apollo Group Involvement: Meenakshi and Dhruv Gupta takeover
- Open Offer @ ₹450: Premium over CMP but past its deadline
- ₹600 Cr Capex: Scale up to 2.5 Mn tons by FY27
- Solar Orders Worth ₹266 Cr: Push into renewables
- Frequent Resignations: CFO + statutory auditors walked in FY24
- Bonus Issue: 5.57 Cr shares allotted
7. Balance Sheet
| Item | FY24 | FY25 |
|---|---|---|
| Equity Capital | ₹11 Cr | ₹11 Cr |
| Reserves | ₹1,076 Cr | ₹1,197 Cr |
| Borrowings | ₹182 Cr | ₹722 Cr |
| Total Assets | ₹1,487 Cr | ₹2,298 Cr |
Key Takeaways:
- Debt jumped 4x in one year
- Reserves growing, but asset-light? Not anymore.
- Capex-heavy strategy might weigh down balance sheet if revenue doesn’t catch up
8. Cash Flow – Sab Number Game Hai
| Cash Flow | FY24 | FY25 |
|---|---|---|
| Operating | ₹-14 Cr | ₹-391 Cr |
| Investing | ₹-1,059 Cr | ₹-87 Cr |
| Financing | ₹+1,184 Cr | ₹+479 Cr |
Interpretation:
- Negative Operating Cash Flow = 👎
- Capex fully funded by borrowing and equity
- Classic “we’ll scale, trust us” narrative
9. Ratios – Sexy or Stressy?
| Ratio | FY24 | FY25 |
|---|---|---|
| ROCE | – | 11.3% |
| ROE | – | 9.01% |
| Debtor Days | 12 | 20 |
| Inventory Days | 10 | 16 |
| Cash Conversion Cycle | -5 | 14 |
Verdict:
Working capital manageable (cycle of 14 days), but margin profile screams “trading-led” not “value-add manufacturing”.
10. P&L Breakdown – Show Me the Money
| FY | Sales | OPM % | PAT | EPS | Other Income |
|---|---|---|---|---|---|
| FY24 | ₹2,683 Cr | 2.3% | ₹61 Cr | ₹5.46 | ₹32 Cr |
| FY25 | ₹5,856 Cr | 1.76% | ₹103 Cr | ₹9.20 | ₹80 Cr |
Sharp EPS growth, but… is it sustainable if other income normalizes?
11. Peer Comparison
| Company | CMP | P/E | Sales (Qtr) | PAT (Qtr) | ROCE | OPM |
|---|---|---|---|---|---|---|
| L&T | ₹3,464 | 31 | ₹74,392 Cr | ₹6,155 Cr | 14.49% | 13.4% |
| NBCC | ₹113 | 50 | ₹4,642 Cr | ₹182 Cr | 33.5% | 5.2% |
| KEC Intl | ₹875 | 41 | ₹6,872 Cr | ₹268 Cr | 16% | 6.9% |
| SG Mart | ₹375 | 40.8 | ₹1,595 Cr | ₹33 Cr | 11.3% | 1.76% |
Comment: Valuation close to blue-chips, but operating margin closer to a dhaba.
12. Miscellaneous – Shareholding, Promoters
| Quarter | Promoters | FIIs | DIIs | Public |
|---|---|---|---|---|
| Sep 2022 | 94.69% | 0% | 0% | 4.4% |
| Jun 2025 | 36.27% | 0.91% | 5.70% | 57.13% |
- Massive promoter dilution — over 58% stake sold
- Retail & DIIs now dominate — classic “story stock” pattern
- New leadership but high churn (CFO, auditors resigned)
13. EduInvesting Verdict™
SG Mart Ltd is an unusual metamorphosis story. From obscurity to ₹6,000 Cr revenue, from ₹0 PAT to ₹100 Cr PAT, from old management to new Apollo-aligned promoters.
Yet, behind the glam:
- Operating margins remain threadbare
- Cash flows are negative
- “Other Income” is doing more lifting than steel rebars
Conclusion:
It’s not just a turnaround story—it’s a narrative IPO that never IPO’d. SG Mart needs to now prove that it can grow profitably without the drama. If you’re on board, keep your seatbelt fastened. If not, don’t fall for the ₹450 Open Offer nostalgia.
Metadata
– Written by EduInvesting Analyst | 18 July 2025
– Tags: SG Mart, APL Apollo, Capex Stocks, Solar Infra, Construction Retail, Smallcap Stories, EduInvesting Premium Research


