01 — At a Glance
The Bling Factory That Just Printed ₹3,000 Crores in 90 Days
- 52-Week High / Low₹406 / ₹240
- Q3 FY26 Revenue₹3,032 Cr
- Q3 FY26 PAT₹267 Cr
- Q3 FY26 EPS (₹)16.28
- Annualised EPS (Q3×4)₹65.1
- Book Value₹130
- Price to Book2.24x
- Dividend Yield0.34%
- Debt / Equity1.13x
- Stores (as of Jun 2025)186+
The Executive Summary: Senco Gold just delivered what management called a “historic quarter” — ₹3,032 cr revenue (+50% YoY), ₹267 cr PAT (+689% YoY), and a 13.2% EBITDA margin in Q3. Yes, gold prices spiked. Yes, Dhanteras happened. Yes, hedging losses got neutralized. But here’s the plot twist: consumers are buying more bling at higher prices, just not in the weights Grandma wanted. The company is adapting faster than your local jeweller can restock. P/E at 9.87x looks cheap until you realise 60% of those profits are one-time margin benefits from gold appreciation.
02 — Introduction
Gold Is ₹1.5 Lakh Per Gram. Indians Don’t Care.
Gold prices rose ~65% year-over-year and ~23% within the quarter. A typical Indian consumer’s instinct would be to pause, wait, and reconsider. Instead, Senco Gold processed a record ₹3,000 crore in three months. The stock is down 22% from 52-week high, but the business is not.
This is a story about a 40-year-old jewellery brand that learned to dance in chaos. When gold prices spike, demand drops by weight but not by rupee value. So Senco responded: launch 9-carat hallmark gold (previously unheard in India). Launch lightweight designs. Launch “Marigold” wedding schemes with fixed rates. Launch acquisition of a Gen-Z jewellery platform (Melorra, 68% for ₹68 crore). In other words: when the market sends you lemons, you don’t just make lemonade—you open a beverage conglomerate.
Eighth straight quarter of same-store sales growth. 196 stores by December 2025, up from 175 in March 2025. Non-eastern region growing at 25-30% annually. FY27 guidance: 20% topline growth. A ₹500 crore capital raise approved. PE investors sniffing around because Indian weddings are 365-day businesses and gold penetration in Tier-III/IV cities is still single-digit in % terms.
The stock is not trading at growth multiples. In fact, the P/E of 9.87x is screaming “nobody’s paying attention.” Let’s fix that.
From the February 2026 Concall: Management disclosed that Q3’s 13.2% adjusted EBITDA margin comprises ~9.5-10% “core business” margin and ~2-2.5% “gold price realisation gain.” Annualised core margin: 7.5-7.8%. That’s your steady-state. Everything beyond is butter on bread.
03 — Business Model: How Do They Make Gold Sexy Again?
Buy Gold Sheets. Design. Sell. Repeat. With 196 Showrooms As Your Network.
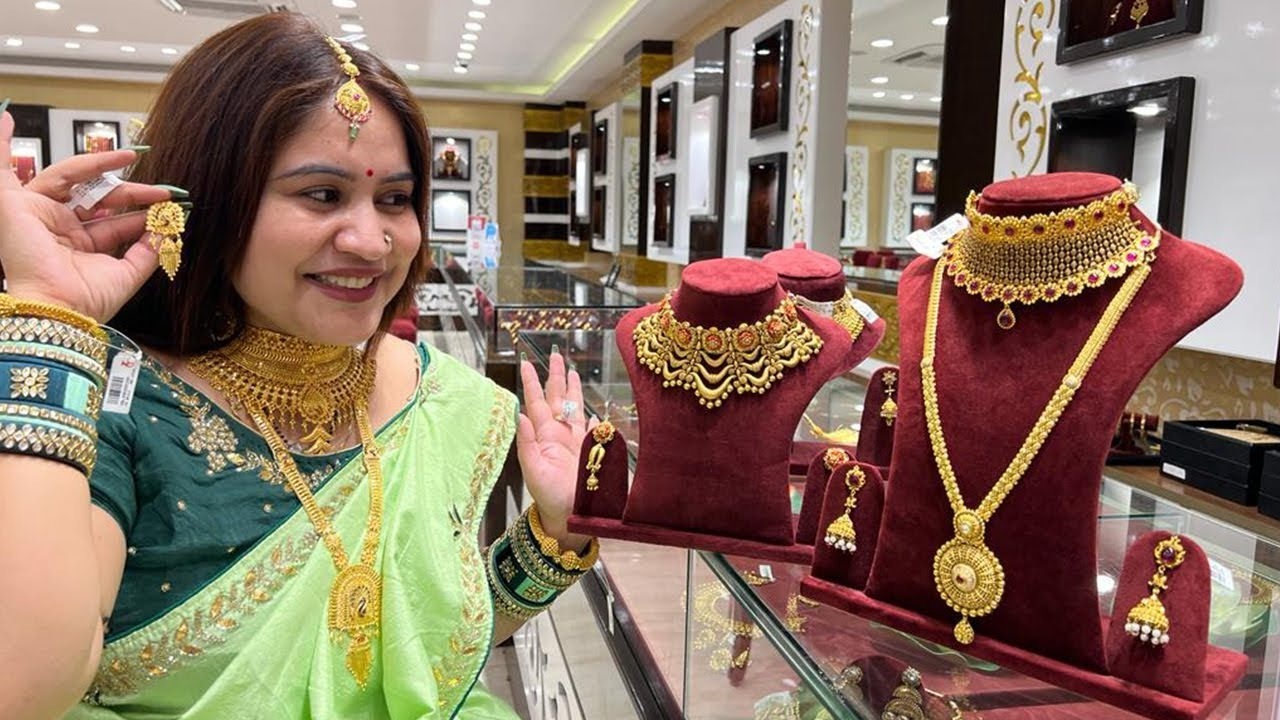
Senco Gold manufactures and retails jewellery across gold, diamond, polki, platinum, and silver. Simple. The twist: they operate 196 stores (110 COCO, 76 franchisee as of June 2025), with 5.48 lakh square feet of retail space, across 7 states + Dubai. Average ticket value: ₹79,400. Average sales price per item: ₹52,300.
Design is the moat. 1.82 lakh+ gold designs. 1.04 lakh+ diamond designs. ~75% internally manufactured by 192 karigars. They launch 6,000+ new gold designs and 3,000+ new diamond designs every quarter. The concall notes emphasized “house of design” positioning—meaning variety, newness, and hyperlocal assortment that your neighbourhood jeweller can’t match.
Channel mix: ~65% own retail + ~33% franchisee + 2% other. Own stores carry 18-20% gross margin. Franchisee sales only 7-8% margin. E-commerce / exports: 5%. This gross-margin architecture is the lever for consolidated profitability—shift 1% of mix toward COCO and you move 100-150 basis points on overall EBITDA margin.
Working capital is the anchor. Inventory days: 166-188 days (meaning they carry ~₹4,600 crore in gold and studded inventory as of September 2025). Payables: 98 days. Receivables: 6 days. Net cash conversion cycle: ~220 days. This is why they carry ~₹2,408 crore in debt—funding the gold inventory, not expansion capex.
Stud Ratio~11%Diamond-studded mix
Gold Volume-3% (Q3)Weight declined YoY
Diamond Volume+12.5%Units growing despite prices
Stores196+Largest in Eastern India
The Affordability Play: Gold prices rose ~65% YoY, yet consumers didn’t stop buying. Instead, they traded down—lower weight, lower carat (9-carat, 14-carat), or higher studded content. Senco’s design-heavy playbook and breadth across purity options allowed them to monetise this shift rather than lose to cheaper unbranded alternatives.
04 — Financials Overview
Q3 FY26: The Record Quarter Broken Down
Result type: Quarterly Results | Q3 FY26 EPS: ₹16.28 | Annualised EPS (Q3×4): ₹65.1 | 9M FY26 EPS: ~₹23.4 (rough annualised: ~₹31.2)
| Metric (₹ Cr) |
Q3 FY26
Dec 2025 |
Q3 FY25
Dec 2024 |
Q2 FY26
Sep 2025 |
YoY % |
QoQ % |
| Revenue | 3,032 | 2,023 | 1,554 | +49.9% | +95.1% |
| Operating Profit | 404 | 79 | 108 | +410.1% | +274.1% |
| OPM % | 13.3% | 3.9% | 6.9% | +940 bps | +640 bps |
| PAT | 267 | 33 | 53 | +709.1% | +403.8% |
| EPS (₹) | 16.28 | 2.03 | 3.24 | +701.5% | +402.5% |
What Management Said vs What Actually Happened: 50% revenue growth was real—mix of gold price appreciation + volume growth in select categories. But OPM expansion from 3.9% to 13.3% (940 bps!) needs deconstruction. Management clarified: ~9.5-10% “core business margin” + ~2-2.5% “gold price realisation benefit.” The adjusted comparison (FY25 Q3 adjusted EBITDA ₹107 cr → FY26 Q3 ₹404 cr) shows adjusted margin ~13.2%, still elevated but not as dramatic. Q3 carries structural operating leverage because October is Dhanteras (gold-buying festival) with pre-planned inventory—fixed costs don’t scale up.
05 — Valuation: Fair Value Range Only
What’s This Bling Really Worth?