01 — At a Glance
The Offshore Services Company That Got Interesting By Accident
- 52-Week High / Low₹1,447 / ₹753
- Q3 FY26 Revenue₹317 Cr
- Q3 FY26 PAT₹100 Cr
- Q3 FY26 EPS₹39.18
- Annualised EPS (Q3×4)₹156.72
- Book Value₹423
- Price to Book3.23x
- Debt / Equity0.38x
- Fleet Size (Vessels)7 Operating
- Dividend Yield0.00%
The Auditor’s Quiet Observation: SEAMEC just posted ₹317 crore in Q3 revenue — a 112% year-over-year jump. PAT of ₹100 crore. Profit up 3,101% over the prior-year quarter. The stock hit ₹1,364 on March 19, 2026 and up 45.8% over the past year. Yet if you Google “SEAMEC,” half the results assume it’s a company that teaches Hindi grammar. Meanwhile, two weeks into Q4, ONGC awards a ₹410 crore O&M contract to a SEAMEC consortium. The market’s fastest-growing offshore player is hiding in plain sight, and the narrative is still being written.
02 — Introduction
Welcome to Underwater Maintenance Theatre: Where Contracts Are Vessels & Margins Are Thick
SEAMEC Limited is a subsidiary of HAL Offshore Limited, a Delhi-based offshore services company part of the M. M. Agrawal Group. HAL Offshore acquired 75% stake in Seamec from Tehnip (France) in FY14 and currently holds 72.72% of the company. The business model is straightforward: own deepwater vessels, deploy them for ONGC subsea operations, maintain aging oil platforms, and collect substantial day rates. Rinse, repeat, add another vessel to the fleet.
The company operates the largest fleet of multi-functional Diving Support Vessels (DSVs) and Offshore Support Vessels (OSVs) in India. Translation: when ONGC needs to fix something 400 meters underwater in the Arabian Sea, they call SEAMEC because the alternatives are either foreign companies (more expensive) or insolvent competitors (more risky). SEAMEC has maintained 72.7% promoter holding (via HAL) and never had a bad debt. That counts for something when you’re operating a ₹405 crore debt book.
The FY26 story is simple: Full deployment of 7 vessels for most of the year. Long-term contracts with ONGC at sustained charter rates. A one-time contribution from a third-party vessel arrangement (₹22 crore in Q3 alone). And market suddenly waking up to the fact that maritime plays work when you’re inside India’s monopoly oil company.
Management framed Q3 FY26 as a “landmark quarter” in the concall. Translation: we made the most money ever. The stock is responding. But the narrative remains uncrowded — which means opportunities for observers willing to read a boring 60-minute concall transcript.
Concall Note (Feb 2026): “Highest ever vessel deployment in the company’s history.” Management was matter-of-fact about it. No dramatic pause. No press release formatting. Just facts in a voice call. And then the stock moved 46% up in a year anyway.
03 — Business Model: Cargo Cults & Deepwater Contracts
How to Make Money by Sending Boats Down & Not Breaking Them
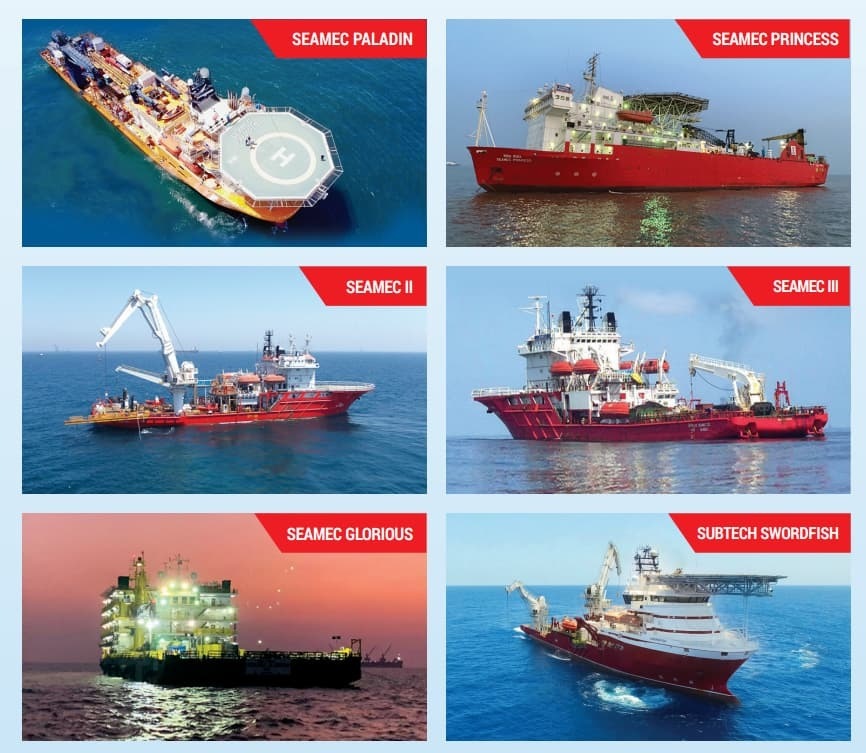
SEAMEC owns seven operational vessels as of Q3 FY26: four Diving Support Vessels (Seamec II, III, Princess, Paladin, Swordfish — wait, that’s five. Swordfish joined in FY26), one Offshore Support Vessel (Seamec Diamond), one Accommodation Barge (Seamec Glorious), and periodically leases a third-party vessel (Goodman, a HAL Offshore asset). All of them serve the same customer 88.5% of the time: ONGC. The other 11.5% goes overseas to international majors and contractors.
Revenue comes from two contract types: IMR (Inspection, Maintenance & Repair) — long-term, year-round, predictable — and EPC (Engineering, Procurement, Construction) — project-based, seasonal, lumpy. Management is deliberately shifting to IMR because it allows full-year deployment, including monsoon season when ONGC typically operates. IMR drives higher utilization. Higher utilization drives compounding returns.
Vessel charter rates vary by capability: a newer, bigger vessel like Swordfish commands ₹20,000–₹25,000 per day. An older vessel like Anant (under acquisition) might fetch ₹8,000–₹12,000/day. Multiply by 365 days and 70% average utilization, and you get rough revenue per vessel. Fixed depreciation, interest, and crew costs are the headwind. But if you keep utilization high and rates stable (which ONGC ensures), margins compress to 40%+ operating profit. In Q3, Seamec pulled 43% operating margin on ₹317 crore revenue.
Fleet Ops7 VesselsDomestic Focus
Utilization70%+9M Avg
Daily Rate₹55K–₹70KAvg Charter
Largest CustomerONGC88.5% Revenue
Business concentration risk is real: ONGC is 88.5% of revenue. One political decision by the government (ONGC’s own stakeholder) could crater earnings. But that same concentration is also the moat — ONGC will not unnecessarily switch to foreign vendors for strategic assets. And India’s subsea infrastructure is aging, so maintenance demand is cyclical upward for 10+ years.
💬 Have you ever thought about who maintains underwater oil pipelines? Neither had we. But someone gets paid ₹100 crore per quarter to do it. Worth a comment?
04 — Financials Overview
Q3 FY26: The Numbers That Broke The Mold
Result type: Quarterly Results (Q3 = Oct-Dec 2025) | Q3 FY26 EPS: ₹39.18 | Annualised EPS (Q3×4): ₹156.72 | 9M FY26 EPS: ~₹31.29 (cumulative)
| Metric (₹ Cr) |
Q3 FY26
Oct-Dec 2025 |
Q3 FY25
Oct-Dec 2024 |
Q2 FY26
Jul-Sep 2025 |
YoY % |
QoQ % |
| Revenue | 317 | 149 | 97 | +112.8% | +226.8% |
| Operating Profit | 136 | 44 | 8 | +209.1% | +1,600% |
| OPM % | 43% | 30% | 8% | +1,300 bps | +3,500 bps |
| PAT | 100 | -3 | -26 | LOSS→PROFIT | LOSS→PROFIT |
| EPS (₹) | 39.18 | -1.31 | -10.81 | TURNAROUND | TURNAROUND |
The prior-year Q3 was a loss-making quarter. This year? Profit of ₹100 crore. That 3,101% profit growth is not extrapolation — it’s a business hitting full stride after years of vessel capex payoff.
Concall Insight (Feb 2026): Management explicitly called out a ₹22 crore contribution from third-party vessel “Goodman” arrangement as a one-time uplift. So Q3 core EBITDA (excluding Goodman) was ~₹128 crore. Still robust. Still profitable. Just not as peak as the ₹22 crore sugar boost suggests. Fair to assume Q4 will see headwinds (Paladin drydock ~₹40–50 crore revenue loss). Full-year FY26 is still tracking to be the best in company history.
05 — Valuation: The P/E Puzzle
What’s A Company Worth When It Prints ₹100 Crore Profits Out of Thin Vessel?
Method 1: P/E Based
Q3 FY26 EPS = ₹39.18. Annualised (Q3×4) = ₹156.72. Current P/E = ₹1,364 ÷ ₹156.72 = 8.7x forward P/E. Full-year FY25 EPS was ₹35.25 (TTM). Current P/E on TTM = ₹1,364 ÷ ₹75.07 = 18.2x. The spread is large because Q3 is an outlier-high quarter. Sector shipping/maritime median P/E is 10.7x. SEAMEC at 18.2x implies 70% premium for growth + ONGC moat. Fair P/E band: 12x–16x (normalized forward earnings).
Range: ₹884 – ₹1,485
Method 2: EV/EBITDA Based
TTM EBITDA (Mar 2025 full year) = Operating Profit ₹322 Cr + Depreciation ₹141 Cr = ₹463 Cr. (Note: Uses Mar 2025 for full-year annual, not quarterly.) Current EV = Market Cap ₹3,464 Cr + Net Debt ₹61 Cr (₹405 Borrowings – ₹344 Cash approx) = ₹3,525 Cr. EV/EBITDA = 7.6x. Shipping/maritime peers trade at 8x–11x EV/EBITDA. Near-zero debt company. Growth tailwind from new vessels coming online. Fair EV/EBITDA band: 9x–12x.
EBITDA (TTM) ₹463 Cr × 9x–12x = EV ₹4,167 Cr – ₹5,556 Cr → Per share:
Range: ₹1,228 – ₹1,642
Method 3: DCF Based (Conservative)
9M FY26 OCF = ₹299 Cr. Full-year FY26 expected OCF = ~₹420 Cr (accounting for Q4 drydock headwind). Growth assumptions: 15% CAGR for next 3 years (vessel additions ramping), 8% thereafter. Terminal growth: 3%. WACC: 10.5% (maritime cost of capital).
→ PV of 5-year OCFs at 10.5%: ~₹2,100 Cr
→ Terminal Value (3% growth / 7.5% cap rate): ~₹2,800 Cr
→ Total EV: ~₹4,900 Cr (net debt ~₹61 Cr negligible)
Range: ₹1,145 – ₹1,620
Fair Min: ₹880
CMP: ₹1,364 | TTM P/E: 18.2x
Fair Max: ₹1,650
CMP ₹1,364 (Mar 19, 2026)
Normalized Fair Value Band
⚠️ EduInvesting Fair Value Range: ₹880 – ₹1,650. CMP ₹1,364 sits in the upper-middle. The TTM P/E of 18.2x reflects Q3’s exceptional profitability. Forward-normalized P/E would be lower (~12–14x) if Q4 shows expected seasonal weakness. This fair value range is for educational purposes only and is not investment advice. Consult a SEBI-registered investment advisor before acting.
06 — What’s Cooking: News, Triggers & Drama
Contracts, Acquisitions & The Infinite Vessel Loop