Rex Sealing & Packing Industries Ltd H1 FY26 – ₹17.3 Cr Sales, EPS ₹3.08, and a Balance Sheet That Looks Older Than Its Promoters (In a Good Way)
1. At a Glance
Rex Sealing & Packing Industries Ltd is that classic Indian manufacturing uncle who has been around since 1963, never changed his profession, never chased fads, and still turns up to work every day with the same lunchbox. Market cap sits at roughly ₹40.5 crore, the stock price is hovering around ₹170, and the company just reported H1 FY26 sales of ₹17.28 crore with PAT of ₹0.70 crore. Returns over the last three months are down nearly 19%, which tells you the market is currently in “moody teenager” mode with this stock. ROCE is at 12.9%, ROE at 11.7%, debt-to-equity is a manageable 0.36, and promoters hold a solid 73% stake without any pledge drama.
The headline takeaway? This is not a flashy story stock. It is a slow, industrial, gasket-and-insulation grinding machine that quietly supplies boring-but-critical products to petrochemical, power, steel, cement, pharma, and chemical plants. The latest half-year results show margin stability but profit compression versus last year, and the stock is priced at a P/E of about 28.5 despite profits cooling off. That mismatch alone makes this worth a deep, sarcastic autopsy. Ready?
2. Introduction
Rex Sealing is what happens when a company discovers its niche early and refuses to leave it for over six decades. Incorporated in 1963, this business has seen license raj, liberalisation, globalisation, and now SME stock market mood swings – and it is still selling jointing sheets, gaskets, insulation jackets, ceramic fibres, and other things that sound boring until a refinery shuts down because a seal failed.
This is not a consumer brand. Nobody flexes Rex gaskets on Instagram. But if you run a power plant or a chemical factory, these products are the difference between “operations normal” and “plant shutdown, boss angry.” That’s the quiet power of industrial consumables.
Financially, the company has grown sales steadily over the years, with three-year sales growth around 18%. But FY25 and the recent half-year show profit volatility, rising costs, and working capital stress. Add to that a preferential issue, capex plans, and increased borrowings, and you have a story that is far more interesting than the stock price chart suggests.
So the real question: is Rex Sealing a boring compounder temporarily out of fashion, or a capital-hungry SME learning the hard way that growth is expensive? Let’s dissect.
3. Business Model – WTF Do They Even Do?
Rex Sealing manufactures sealing, packing, and insulation products that operate in extreme conditions – high temperature, high pressure, corrosive environments, and places where failure is not an option.
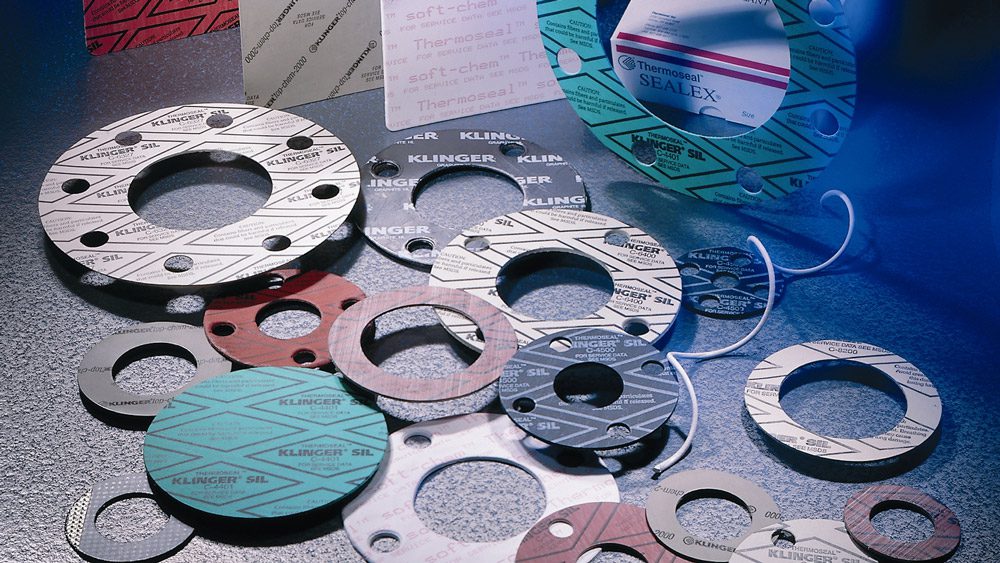
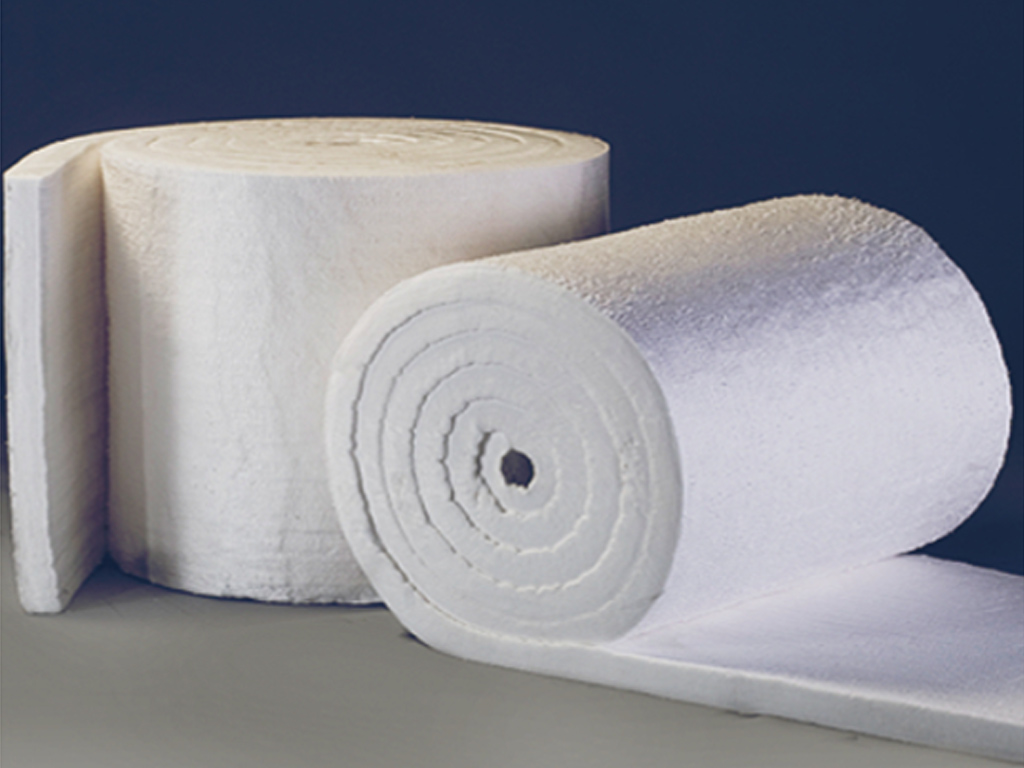
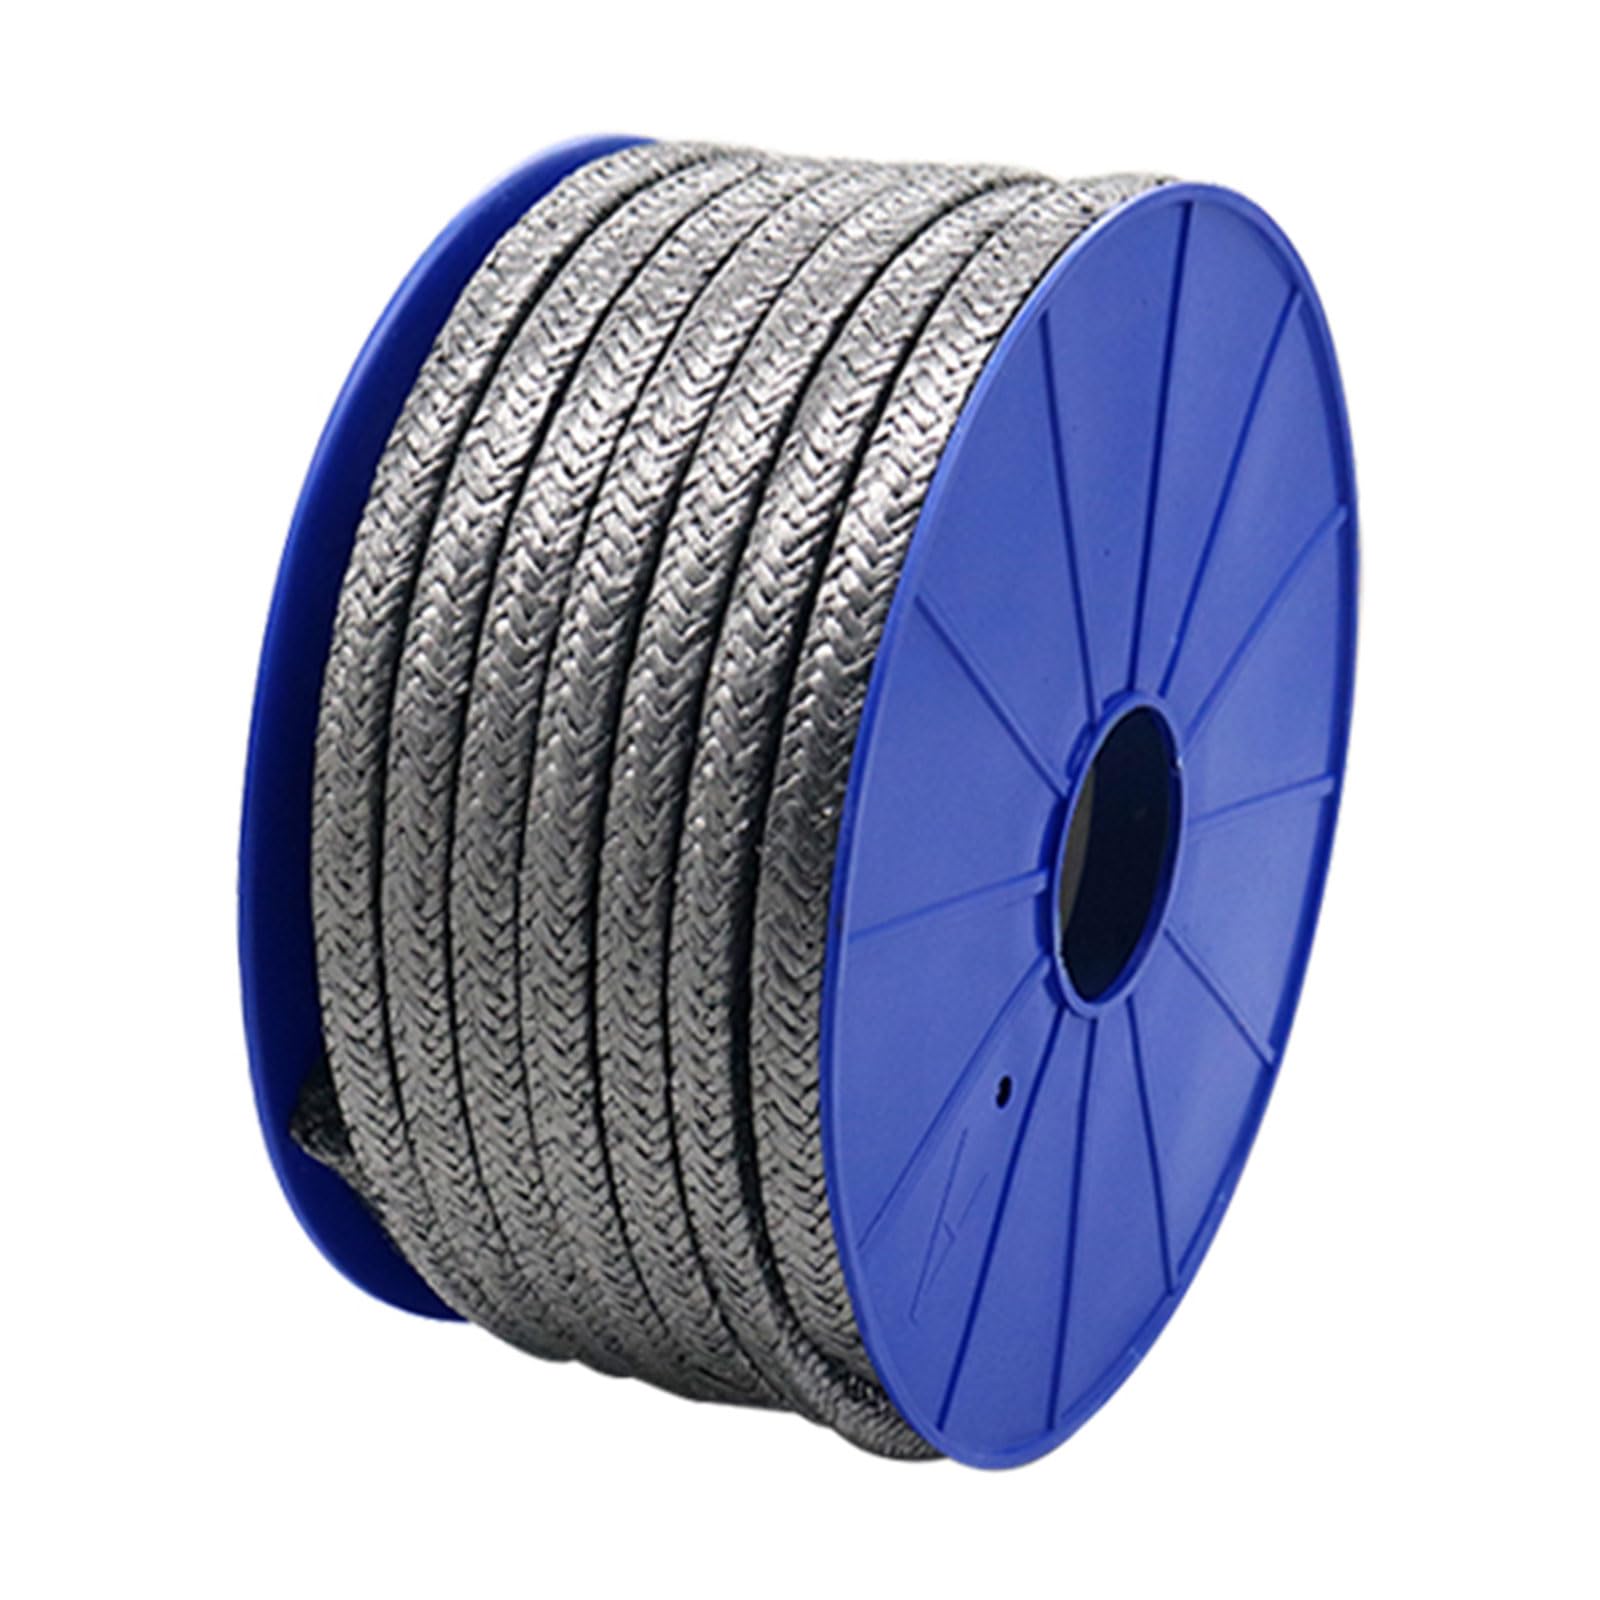
Their product list reads like an industrial engineer’s shopping cart: jointing sheets, fabric expansion joints, gland packing ropes, ceramic fibre products, insulation jackets, silica and silicone products, graphite sheets and rings, vermiculite-coated materials, and tadpole gaskets.
In simple terms: if something vibrates, heats up, expands, contracts, or tries to leak in an industrial plant, Rex wants to seal it.
Revenue-wise, the business is well diversified within its niche. In FY24, ceramic fibre contributed ~15%, gasket sheets ~18%, gland packing ~17%, fire-proof sleeves ~14%, and silica products ~16%. No single product dominates, which reduces risk.
Geographically, this is a domestic-heavy story. About 95% of revenue comes from India, with exports contributing only ~5%. That tells you two things: one, Rex is deeply plugged into Indian industrial demand; two, export optionality exists but is not yet a growth driver.
Customers span petrochemical, pharmaceutical, power, steel, cement, chemical, gas, and process industries. Translation: cyclical end markets, but diversified cycles. When steel is down, pharma may still be ordering insulation.
Simple model, proven demand, zero glamour.
4. Financials Overview
Result Type Lock
The latest official result heading is Half Yearly Results. This is a HALF-YEARLY RESULTS set. Annualised EPS = Latest EPS × 2
Latest H1 FY26 EPS = ₹3.08 Annualised EPS ≈ ₹6.16
Half-Yearly Performance Table (₹ Crore)
Source table
Metric
Latest H1 (Sep 2025)
YoY H1 (Sep 2024)
Prev H1 (Mar 2025)
YoY %
QoQ %
Revenue
17.28
18.16
16.63
-4.85%
+3.9%
EBITDA
1.73
1.73
1.49
0.0%
+16.1%
PAT
0.70
1.15
0.72
-39.1%
-2.8%
EPS (₹)
3.08
5.18
3.24
-40.5%
-4.9%
Witty takeaway: sales slipped a bit, EBITDA refused to grow, and PAT fell off a small cliff thanks to higher interest and depreciation. EBITDA margins are holding near 10%, but bottom-line pressure is real.
Question for you: do you care more about stable margins or