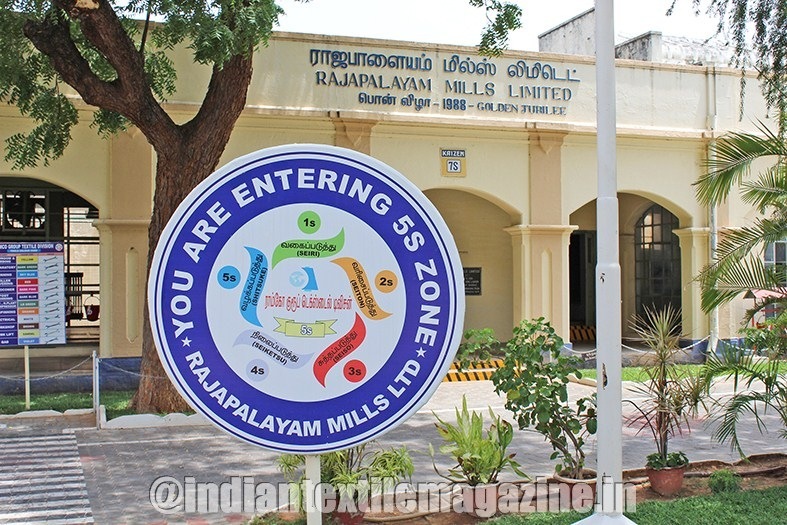
1. At a Glance
Rajapalayam Mills Ltd (RML) — the OG textile child of the Ramco empire — just dropped a quarterly show that deserves both a slow clap and a facepalm. The stock sits at ₹820, down 8% in three months, with a market cap of ₹756 crore — that’s less than what its investment in Ramco Cements alone is worth. You read that right.
Despite holding ₹3,000+ crore in investments, RML’s balance sheet looks like a cautionary tale on how to be rich on paper but broke in cash. For Q2FY26, the company clocked ₹241 crore in revenue and ₹17.1 crore PAT, a 422% profit jump YoY, mostly thanks to cost control, not magic. But debt — oh boy — sits at ₹1,163 crore, quietly whispering EMI lullabies.
ROCE? 0.43%. ROE? 0.71%. The kind of numbers that make your CA sigh deeply before charging overtime. With a book value of ₹2,540 per share, the stock trades at just 0.32x book, meaning it’s cheaper than a Madurai lunch thali — but for good reason. Interest coverage barely at 0.39x, and profits running on fumes, this mill is spinning more debt than yarn.
2. Introduction
Once upon a time in 1936, when Gandhi still wore khadi and not polyester, Rajapalayam Mills began its story. Today, it’s not just any mill — it’s the textile heart of the Ramco Group, the same clan that brought you Ramco Cements, Ramco Systems, and Ramco Industries.
But unlike its famous cement sibling, RML hasn’t been building much wealth lately. With over ₹3,000 crore invested in group companies, this mill is less of a textile manufacturer and more of a family office with spinning machines.
The last few years have been a dramatic soap opera of expansion, debt, and auditor resignations. The company spent ₹374 crore in FY24 on new looms and modernisation, funded partly by rights issues and loans backed by Ramco Cements shares. Basically, they turned their equity portfolio into an ATM for capex.
And then there’s the renewable twist — RML runs 35 MW of wind power and 17 MW of captive solar, meeting over 85% of its energy needs through renewables. Because even if profits vanish, at least the ESG rating stays woke.
3. Business Model – WTF Do They Even Do?
RML manufactures cotton yarn and fabrics. That’s the simple answer. The complicated answer? It’s an empire of spindles, looms, and windmills trying to stay relevant in a world obsessed with polyester and athleisure.
The company produces fine-count yarns (4s to 300s), including fancy stuff like mélange, mercerized, slub, and gassed yarn. It sells to apparel manufacturers, home textile brands, and other mills. Basically, RML makes the fabric that makes the clothes that make the influencers who make you buy them.
Production facilities in Rajapalayam, Tamil Nadu hum with ~1.52 lakh spindles, 328 looms, and 2,960 rotors. In FY24, they sold 127 lakh kg of yarn and 122 lakh meters of fabric. That’s serious volume — but margins
remain thin.
The real twist? Power generation. RML owns windmills (35 MW) and solar (17 MW), plus more from captive suppliers like Green Infra and Cleanmax. Over 85% of its power now comes from renewable sources — not bad for a company old enough to remember typewriters.
So yes, it spins yarn, weaves cloth, and powers itself. But the real business these days? Spinning stories for banks to refinance ₹1,250 crore in debt.
4. Financials Overview
Quarterly Comparison (₹ Cr)
| Metric | Latest Qtr (Sep’25) | YoY Qtr (Sep’24) | Prev Qtr (Jun’25) | YoY % | QoQ % |
|---|---|---|---|---|---|
| Revenue | 241 | 229 | 189 | 5.3% | 27.5% |
| EBITDA | 42 | 27 | 23 | 55.6% | 82.6% |
| PAT | 17.1 | 3.3 | 8.0 | 422% | 113% |
| EPS (₹) | 18.54 | 3.60 | 8.81 | 415% | 110% |
Commentary:
Profit up 422% — sounds dramatic until you remember that last year’s base was near zero. RML didn’t suddenly turn into a money-printing machine; it just had fewer surprises this time. Operating margins at 17% are decent, but debt costs are still chewing into the bottom line. The mills are running fine — the problem is the bankers are running faster.
5. Valuation Discussion – Fair Value Range
Let’s crunch some desi math.
P/E Method:
EPS (TTM) = ₹59.5
Industry average P/E = 19.7
Conservative range: 10x–15x
→ Fair Value Range = ₹595 – ₹893
EV/EBITDA Method:
EV = ₹1,908 Cr
EBITDA (FY25) = ₹95 Cr
EV/EBITDA = 20x (ouch).
Industry median ~12–15x → suggests stock is slightly expensive on operating front.
DCF (Simplified):
Assuming FCF stabilises at ₹50 Cr, growth 3%, discount rate 11%, perpetual formula → Fair Value ≈ ₹625–₹850
✅ Educational Range: ₹600 – ₹900 per share
Disclaimer: This fair value range is for educational purposes only and is not investment advice.
6. What’s Cooking – News, Triggers, Drama
RML has been busier with corporate drama than fabric orders lately.
- Auditor Shuffle: M/s N.A. Jayaraman & Co. exited stage left, replaced by M/s SRSV Associates in FY24. Because what’s a Ramco company without a mid-season auditor switch?
- Big Borrowing Limit: AGM on 29-Aug-2025 approved raising borrowing limit from ₹750 Cr to ₹850 Cr. When in doubt, raise the ceiling.
- Postal Ballot Mania: In

