Raja Bahadur International Ltd Q2 FY26 – ₹266 Cr Debt, ₹6.99 Cr Quarterly Sales, 89x P/E: Royal Legacy, Rented Cashflows, Relentless Leverage
1. At a Glance – The 99-Year-Old Maharaja With EMI Problems
Founded in 1926, Raja Bahadur International Ltd is almost a century old. That alone gives it senior-citizen respect in Dalal Street. But instead of quietly living off fixed deposits and dividend pensions, this company decided to play high-stakes real estate Monopoly with borrowed money. As of the latest numbers, Raja Bahadur International sits at a market cap of ₹117 crore, trades at a princely price of ₹4,665 per share, and flaunts a stock P/E of 89.7 — which is either extreme optimism or extreme confusion.
Quarterly sales stand at ₹6.99 crore, with a PAT of ₹0.76 crore in the latest quarter. Sounds decent until you zoom out and notice ₹266 crore of debt parked comfortably on the balance sheet like an uninvited wedding guest who refuses to leave. ROE is negative at -7.34%, book value is ₹454, and the stock trades at over 10x book. Over the last one year, the stock is down 34%, but in true Bollywood style, the last quarter profit grew 173% YoY — because nothing excites markets like a comeback teaser.
This is not a growth story. This is not a turnaround fairy tale. This is a rent-collecting, interest-paying, debt-heavy, heritage real estate saga with occasional profits popping up like plot twists. Curious yet? You should be.
2. Introduction – From Textile Looms to Lease Deeds
Raja Bahadur International Ltd has lived multiple lives. Born in pre-independence India, it started off manufacturing textiles, bed sets, pillow covers, and even high-precision machine tool accessories. Basically, if it could be stitched, printed, or bolted, Raja Bahadur probably tried it at some point.
Then came the great Indian corporate midlife crisis. The company pivoted — hard — into real estate development, construction of high-end office spaces, and non-conventional power generation. Today, textiles are history, and rental income is the new royalty.
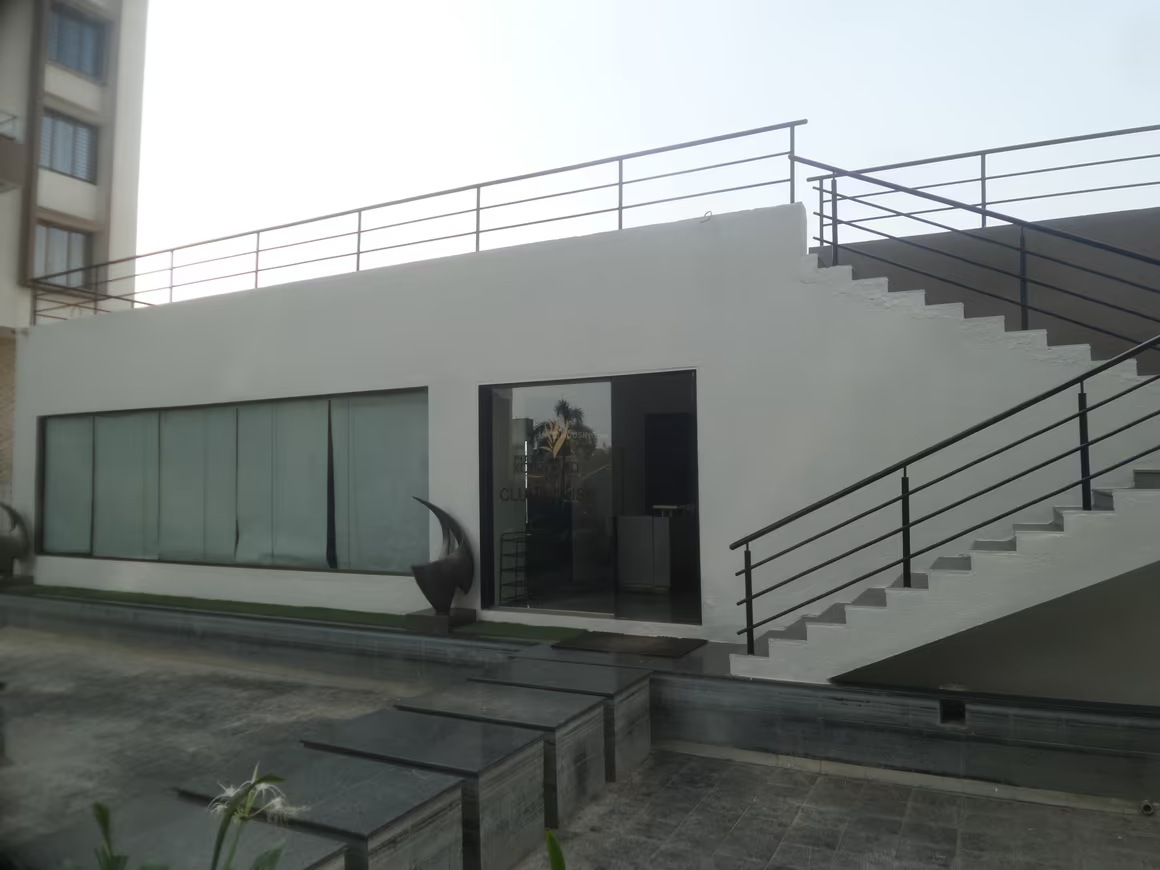
The crown jewel is Raja-Shree Business Park in Pune, leased to none other than Tata Consultancy Services Ltd. When your tenant is TCS, rent cheques are more predictable than Indian weddings having paneer. This single decision explains why operating margins are eye-popping at nearly 50%, despite low absolute revenues.
But before you clap, remember: this company has been reporting recurring losses for many years. Profitability has been inconsistent, interest costs are heavy, and leverage is sky-high. In FY22, management even approved accepting fixed deposits from members to meet working capital needs — a polite corporate way of saying, “Cash tight hai, boss.”
So this is not a clean landlord story. This is a landlord who borrowed aggressively, survived multiple bad cycles, and is now trying to stabilize while the EMI clock keeps ticking.
3. Business Model – WTF Do They Even Do?
At present, Raja Bahadur International does three main things:
First, real estate development. This includes residential projects like Pittie Kourtyard at Kharadi, Pune, where management claims to have sold most of the inventory. Residential sales contribute roughly 48% of revenue historically, though this fluctuates wildly year to year.
Second, commercial leasing. The Raja-Shree Business Park leased to TCS is the company’s cash cow. Rental and related revenue accounted for about 34% of revenue in FY22. This part of the business is boring, stable, and exactly what lenders love — which explains how the company keeps rolling over debt.
Third, sale of development rights and miscellaneous income, including TDR sales (~15%) and small retail shop sales. These are opportunistic, lumpy, and unpredictable — like Mumbai real estate conversations at family dinners.
The model is simple on paper: build assets, lease them, sell inventory when markets allow, and pray that interest costs don’t eat you alive. Execution, however, is where things get spicy. High leverage means every quarter matters. One bad leasing cycle or delayed sale and suddenly profits disappear faster than affordable housing in Pune.
Ask yourself: is this a stable annuity-style landlord, or a leveraged developer wearing a rental mask?
4. Financials Overview – Quarterly Numbers With Mood Swings
Result Type Locked: Quarterly Results Latest official result heading clearly states quarterly results. EPS is therefore annualised by multiplying latest quarterly EPS by four.
Quarterly Comparison Table (₹ crore)
Source table
Metric
Latest Quarter (Sep 2025)
Same Qtr Last Year
Previous Quarter
YoY %
QoQ %
Revenue
6.99
6.71
6.95
4.17%
0.58%
EBITDA
4.39
4.59
1.09
-4.36%
302.8%
PAT
0.76
-1.04
-1.21
173.1%
Turned Positive
EPS (₹)
30.4
-41.6
-48.4
NA
NA
Annualised EPS (Quarterly): ₹30.4 × 4 = ₹121.6
Here’s the comedy: revenue barely moves, EBITDA swings like a pendulum, and PAT alternates between profit and loss depending on interest, other income, and tax gymnastics. This is not operational consistency; this is financial parkour.
Still, a profit is a profit. And after many red quarters, even a ₹0.76 crore PAT feels like a small victory parade.
Do you trust profits that depend this heavily on timing and financing?