R K Swamy Ltd – ₹758 Cr Market Cap, -40% 1Y Return, and Still Pitching Like Mad Men in 2025
1) At a Glance
R K Swamy, India’s OG ad-agency-turned-data-analytics hybrid, is now a listed smallcap with ₹758 crore market cap. The stock is hanging at ₹150, a far cry from its IPO high of ₹289, and it’s been a rollercoaster worse than a TRP chart of Indian soap operas. Despite a fancy 39× P/E, FY25 PAT slipped 53%. They talk about IMC, MarTech, thought leadership—but investors are stuck with debtors at 181 days and a -40% one-year return. Classic case: glitzy pitch decks, sobering balance sheet.
2) Introduction
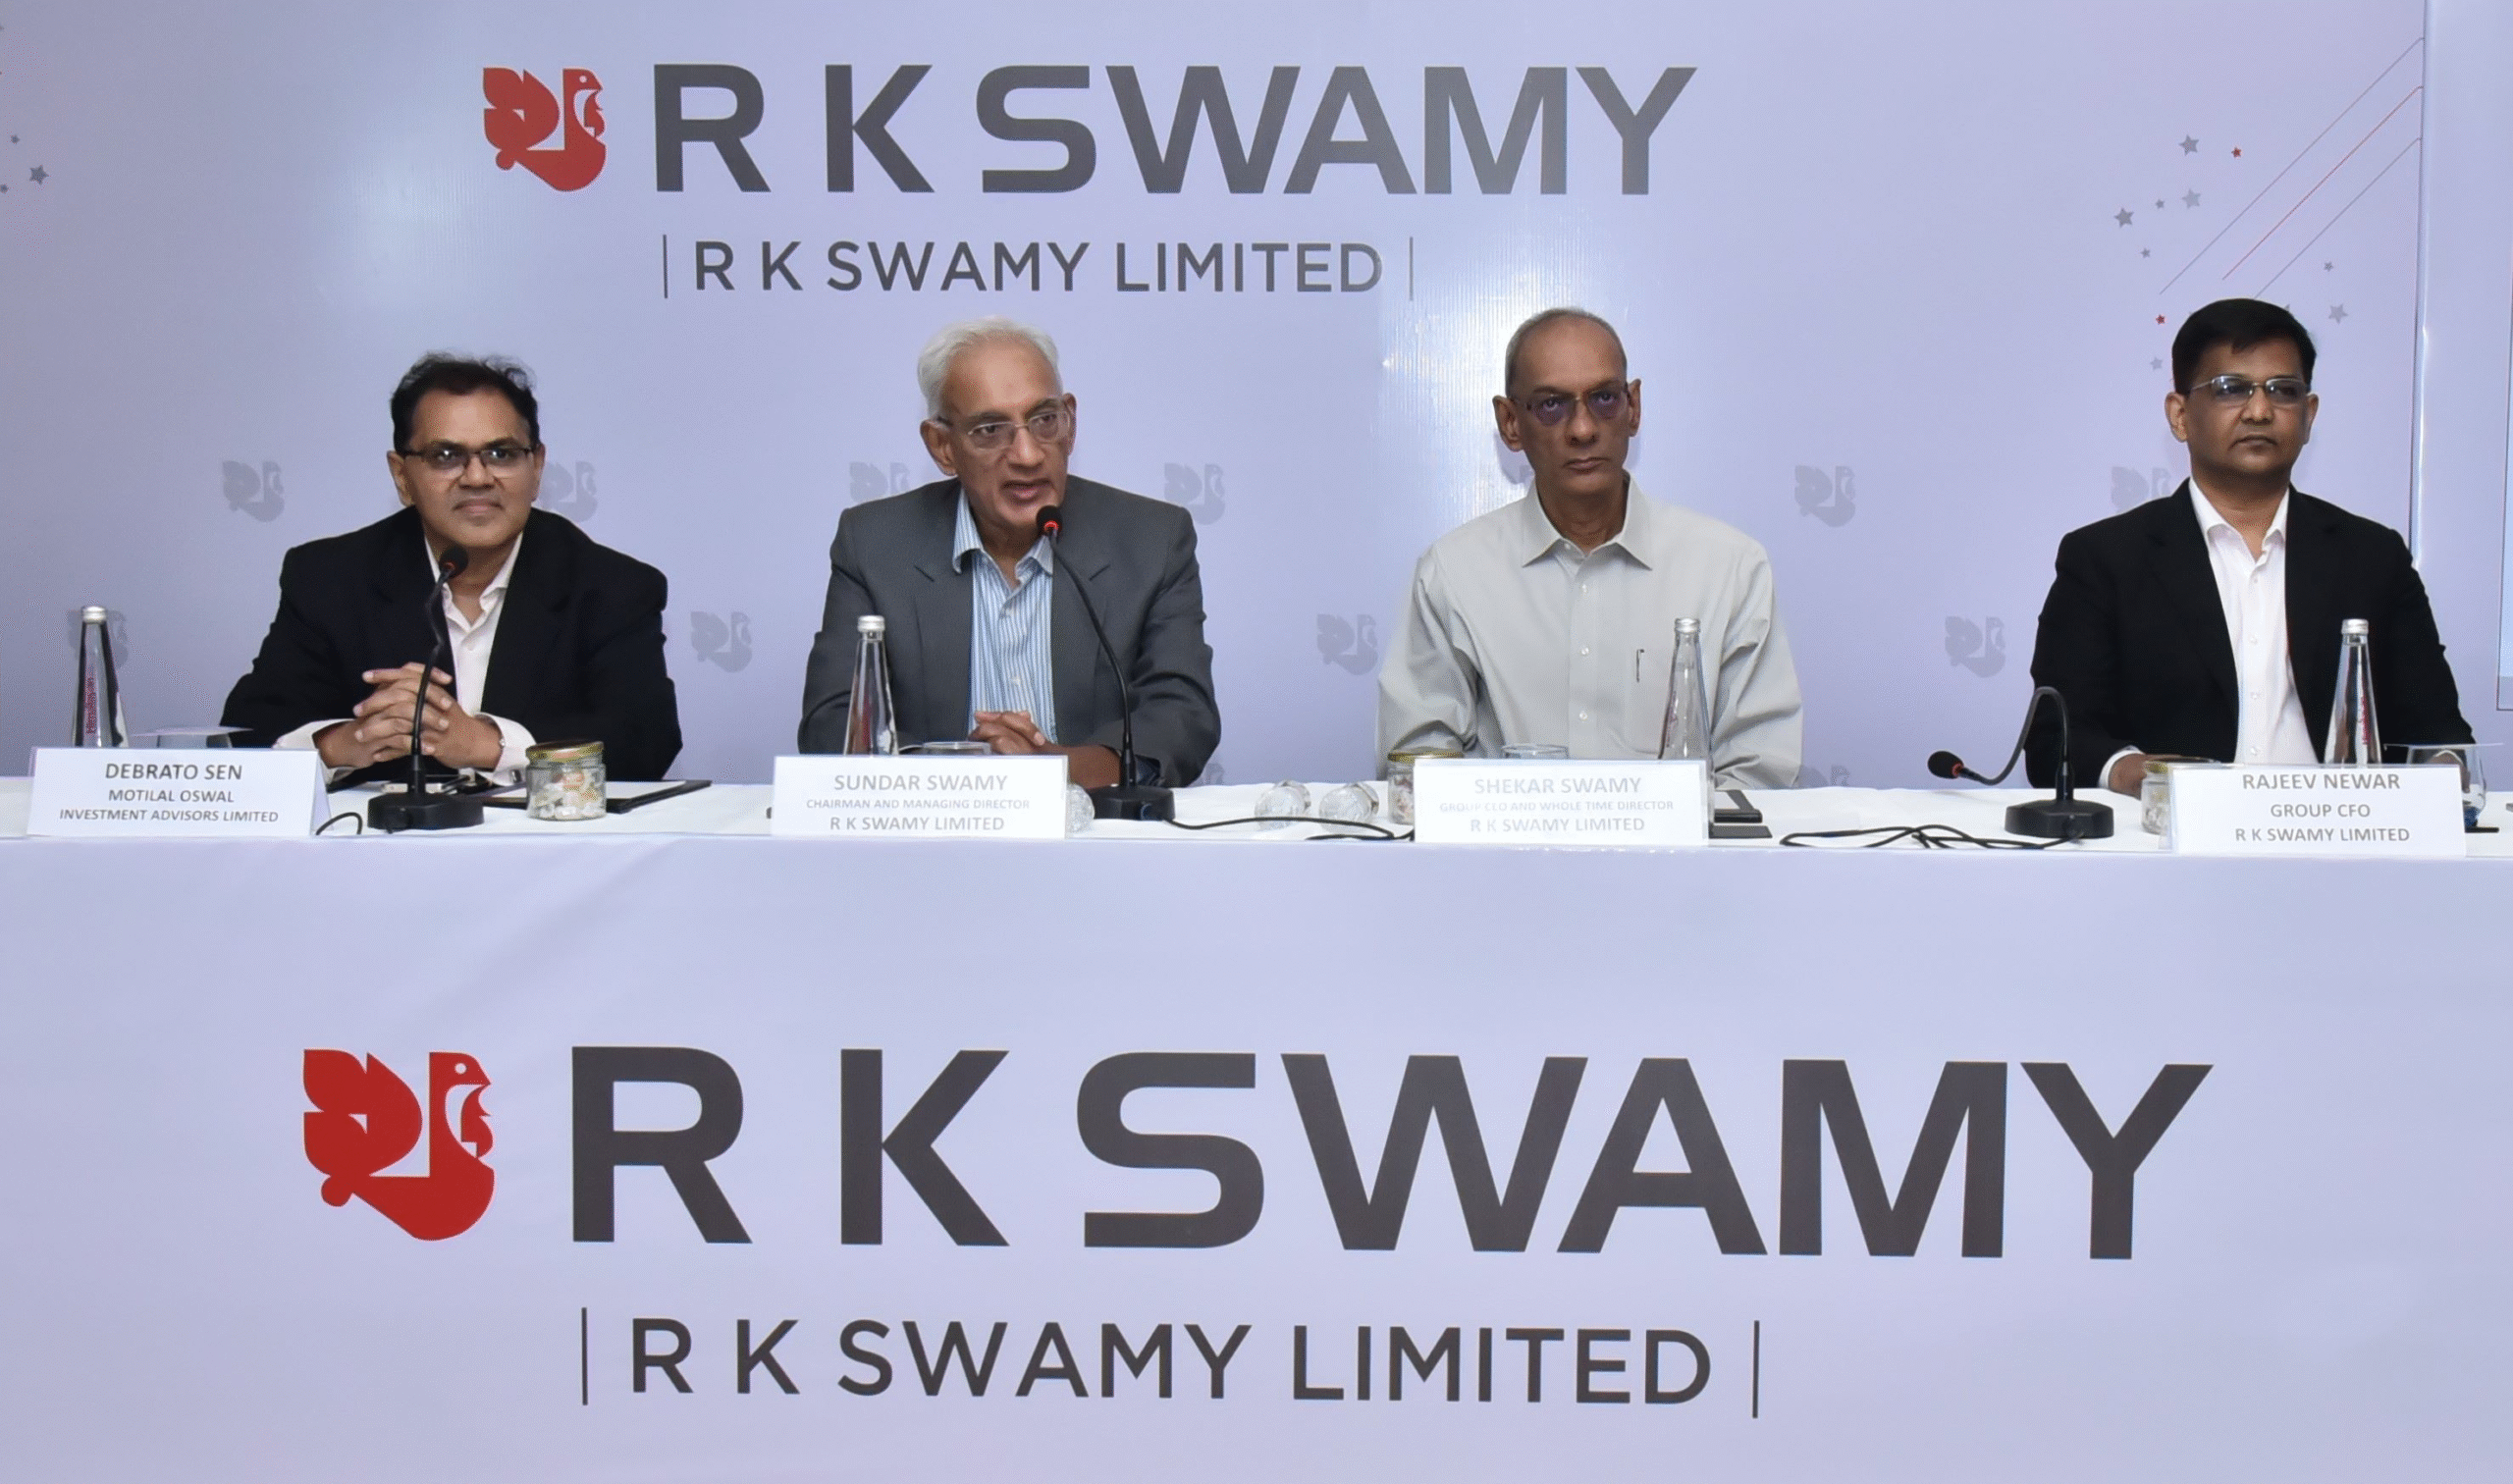
If Don Draper was reincarnated in India, he’d probably be working at R K Swamy, selling you both a TV commercial and a data dashboard. Founded in 1973, the company built its name in advertising, market research, analytics, and MarTech. They boast of Hansa Research (ISO-certified) and units like Hansa Customer Equity that claim to know more about your buying habits than your spouse.
But while clients may be impressed, shareholders are less amused. IPO investors who expected a shiny marketing unicorn instead got an ad agency that behaves like Doordarshan during ad breaks—slow, long, and full of “we will improve next year.”
The paradox: the Indian advertising industry is growing, consumption is booming, and yet R K Swamy’s revenues are crawling at ₹303 crore FY25, profits down, and ROE at 7.6%—barely better than a savings account with your neighbourhood co-op bank.
3) Business Model – WTF Do They Even Do?
Let’s break down the R K Swamy buffet:
Advertising: TV, print, radio, outdoor. Basically everywhere your eyes get assaulted.
Media Buying & Planning: Ensuring ads appear right between your cricket match and your mom’s daily soap.
Market Research: Through Hansa Research—surveys, focus groups, reports that tell clients what customers already know.
Analytics & MarTech: Customer data platforms, engagement solutions, dashboards with charts nobody reads.
Creative Services & Promotions: Events, campaigns, and integrated marketing communication.
Roast translation: They’re trying to be India’s answer to WPP + Nielsen + Adobe, but scale is more like a mid-tier college fest agency with a lot of alumni pride.
Question: Would you trust a company to “analyse” consumer behaviour when its own stock chart looks like a consumer boycott?
4) Financials Overview
Metric
Latest Qtr (Jun’25)
YoY Qtr (Jun’24)
Prev Qtr (Mar’25)
YoY %
QoQ %
Revenue
77.6
68.4
83.5
+13.5%
-7.0%
EBITDA
6.1
3.9
16.1
+56.5%
-62.1%
PAT
2.87
2.18
12.3
+31.6%
-76.7%
EPS (₹)
0.57
0.43
2.44
+32.5%
-76.6%
Annualised EPS ~₹2.3. CMP ₹150 = P/E ~65× forward. For an ad agency with debtor days longer than Ekta Kapoor serials, that’s Bollywood-level optimism.
5) Valuation – Fair Value Range
A) P/E Method
EPS FY25 = ₹3.8.
Industry multiple = 25–30×.
Fair value range = ₹95 – ₹115/share.
B) EV/EBITDA
EV ~₹662 crore.
FY25 EBITDA ~₹32 crore → 20.6×.
Industry fair range 12–16×.
Value = ₹380–₹510 crore. Equity/share = ₹75 – ₹100.
C) DCF (very rough)
FCF barely visible (CMP/FCF = 151×).
Assuming 8% growth, 11% WACC → value ~₹90–₹120/share.
Edu Range: ₹75 – ₹120/share. CMP ₹150 = premium of 25–100% above fundamentals.
Disclaimer: For educational purposes only, not advice.