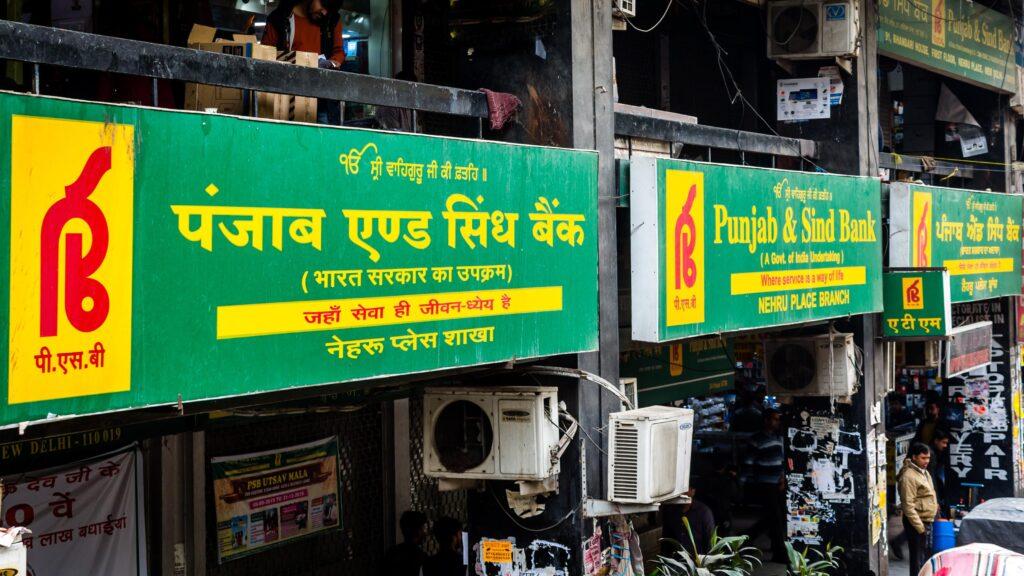
1. At a Glance
A once-forgotten PSU bank now quietly clocking over ₹11,700 Cr in revenue with Gross NPAs dipping below 3.4%. Q1FY26 net profit of ₹269 Cr and strong loan growth are telling a new story… but are investors listening?
2. Introduction with Hook
You know that underdog in every sports movie who gets ignored until he crushes the final act?
That’s Punjab & Sind Bank.
- Gross NPAs: Down from 11.3% in FY22 to 3.34% in Q1 FY26
- Net Profit: ₹1,103 Cr TTM, up from ₹595 Cr in FY24
- Yet… trading at just 0.66x book value
So… mispriced phoenix or just a well-behaved pigeon?
3. Business Model (WTF Do They Even Do?)
Typical PSU bank play, but with a twist:
- Corporate Lending: 38% (9M FY25)
- Retail Loans: 32% (shrinking share)
- Treasury: 29% — surprisingly large for its size
- Fee Income: Coming alive post digital push
Key Strategy:
- Cut NPAs
- Grow retail carefully
- Expand digital & fee-based earnings
- Keep capital adequacy stable post QIP
4. Financials Overview
| Metric | FY23 | FY24 | FY25 | TTM |
|---|---|---|---|---|
| Revenue (Cr) | ₹7,993 | ₹9,694 | ₹11,481 | ₹11,740 |
| Net Profit | ₹1,313 | ₹595 | ₹1,016 | ₹1,103 |
| EPS (₹) | ₹1.94 | ₹0.88 | ₹1.43 | ₹1.59 |
| Gross NPA % | 6.97% | 3.38% | 3.34% | 3.34% |
| Net NPA % | 1.84% | 0.96% | 0.91% | 0.91% |
Key Takeaway:
PSB’s turnaround isn’t theoretical. It’s showing up in real numbers.
5. Valuation
| Method | Metric Used | Fair Value (₹) |
|---|---|---|
| P/BV | 1.0x Book Value ₹18.8 | ₹18.8 |
| P/E | 12x FY26E EPS ₹1.80 | ₹21.6 |
| Peer Avg | Median PSU ROE ~15% | ₹28 – ₹32 |
Fair Value Range: ₹21 – ₹32
CMP: ₹32.3
Conclusion: Fully priced for now — any re-rating depends on ROE >10% and continued NPA improvement
6. What’s Cooking – News, Triggers, Drama
- QIP of ₹3,000 Cr done in FY25 – recap complete
- Credit growth in Q1FY26: healthy, with corporate lending share rising
- NIMs under pressure due to high deposit costs
- RBI penalty in March 2024: ₹68 lakh (non-compliance alert)
- Core Banking upgrade underway
- DII interest rising: From 0.65% to 4.07% over FY25
7. Balance Sheet
| Metric | FY23 | FY24 | FY25 |
|---|---|---|---|
| Equity Capital | ₹6,778 Cr | ₹6,778 Cr | ₹7,096 Cr |
| Reserves | ₹8,331 Cr | ₹8,756 Cr | ₹6,259 Cr |
| Deposits | ₹109,665 Cr | ₹119,410 Cr | ₹129,774 Cr |
| Borrowings | ₹9,018 Cr | ₹9,771 Cr | ₹14,230 Cr |
| Total Assets | ₹136,455 Cr | ₹147,657 Cr | ₹161,815 Cr |
Highlights:
- 10% YoY deposit growth
- Borrowings up sharply: liquidity buffer for credit growth
- Capital ratio comfortable post QIP
8. Cash Flow – Sab Number Game Hai
| Year | CFO | CFI | CFF | Net Flow |
|---|---|---|---|---|
| FY23 | ₹1,428 Cr | -₹88 Cr | -₹1,332 Cr | ₹8 Cr |
| FY24 | ₹1,746 Cr | -₹229 Cr | -₹431 Cr | ₹1,086 Cr |
| FY25 | -₹2,294 Cr | -₹168 Cr | ₹3,898 Cr | ₹1,437 Cr |
Translation:
- FY25 cash burn = growth mode
- Strong capital raise helped balance liquidity
9. Ratios – Sexy or Stressy?
| Ratio | FY23 | FY24 | FY25 |
|---|---|---|---|
| ROE (%) | 9% | 4% | 7% |
| ROA (%) | 0.95% | 0.48% | 0.66% |
| Gross NPA % | 6.97% | 3.38% | 3.34% |
| Net NPA % | 1.84% | 0.96% | 0.91% |
| NIM (Est) | ~2.3% | ~2.4% | ~2.4% |
Not sexy yet. But definitely less stressy than FY20’s apocalyptic figures.
10. P&L Breakdown – Show Me the Money
| Metric | FY23 | FY24 | FY25 |
|---|---|---|---|
| Interest Income | ₹5,019 Cr | ₹6,853 Cr | ₹7,906 Cr |
| Other Income | ₹940 Cr | ₹1,221 Cr | ₹1,843 Cr |
| Total Revenue | ₹7,993 Cr | ₹9,694 Cr | ₹11,481 Cr |
| Net Profit | ₹1,313 Cr | ₹595 Cr | ₹1,016 Cr |
Note: FY24 net profit was hit by provisioning. Recovered well in FY25.
11. Peer Comparison
| Bank | CMP (₹) | P/E | ROE (%) | NPA (Gross) | P/BV | MCap (₹ Cr) |
|---|---|---|---|---|---|---|
| SBI | 823 | 9.4 | 17.2 | 3.0% | 1.5 | ₹7.3 L Cr |
| PNB | 113 | 7.0 | 15.1 | 5.2% | 1.0 | ₹1.3 L Cr |
| IOB | 39.7 | 20.1 | 11.0 | 4.0% | 2.2 | ₹76,622 Cr |
| PSB | 32.3 | 20.8 | 7.0 | 3.3% | 0.66 | ₹22,905 Cr |
Conclusion:
Lowest valuation. Decent asset quality now.
Re-rating possible if ROE crosses 10%.
12. Miscellaneous – Shareholding, Promoters
| Category | Mar 2023 | Mar 2024 | Jun 2025 |
|---|---|---|---|
| Promoters | 98.25% | 93.85% | 93.85% |
| FIIs | 0.01% | 0.73% | 0.25% |
| DIIs | 0.65% | 4.32% | 4.07% |
| Public | 1.1% | 1.11% | 1.84% |
Noteworthy:
- 2.5x growth in public participation
- DII confidence despite PSU baggage
- FIIs still hesitant (understandably)
13. EduInvesting Verdict™
Punjab & Sind Bank is no longer that PSU bank stuck in 2013.
It’s cleaned up its act, improved NPAs, and is finally back in profit territory.
But the stock is still wearing its “I’m a PSU, don’t touch me” hat.
What it needs:
- ROE above 10%
- Sustained earnings growth
- NIMs holding above 2.5%
What it has:
- Dirt-cheap valuation
- Clean balance sheet
- Room for a re-rating rally
Keep watching. One fiscal away from a possible glow-up.
Metadata
– Written by EduInvesting Research | July 20, 2025
– Tags: Punjab & Sind Bank, PSU Banks, Q1 FY26 Results, NPA Cleanup, Turnaround Stories, PSU Bank Rally


