1. At a Glance
A ₹285 Cr small-cap that wraps profits better than it wraps tablets. PG Foils is riding an aluminium upcycle with a twist of other income drama, contingent liabilities, and promoters slowly walking out the back door. Oh, and it’s trading at 0.84x book value. Intrigued yet?
2. Introduction with Hook
Imagine a pharma blister pack without foil. That’s PG Foils in reverse—tiny but essential. This company has made a business out of aluminium that doesn’t fly in planes but wraps tablets, tobacco, chocolates, and controversy.
- Stock P/E: 11.8 (better than cousin Arfin’s 51.3)
- Book Value: ₹286; CMP: ₹242
- OPM last quarter: 7.43% (which is a polite way to say: “Hey, at least it’s not negative anymore”)
3. Business Model (WTF Do They Even Do?)
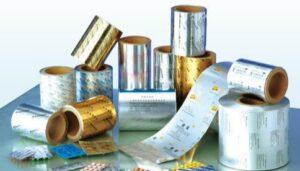
PG Foils manufactures aluminium foil and specialty flexible packaging materials. Clients include Indian and international pharmaceutical companies—basically, their foil is everywhere from hospitals to your kitchen to gutkha packets in tier-3 cities.
Segments:
- Pharma foil
- Household foil
- Flexible packaging for FMCG
- Specialty applications for electronics
Certifications: ISO 9001-2008 and EN 14375 (for safety-critical applications)
4. Financials Overview
Profit & Loss (Standalone)
| Year | Revenue (₹ Cr) | EBITDA (₹ Cr) | Net Profit (₹ Cr) | EPS (₹) |
|---|---|---|---|---|
| FY21 | 252 | 15 | 15 | 18.85 |
| FY22 | 395 | 44 | 47 | 51.2 |
| FY23 | 337 | 2 | 0.2 | 0.2 |
| FY24 | 317 | -21 | 17 | 14.43 |
| FY25 | 491 | 13 | 24 | 20.44 |
- FY25 finally saw profit from operations and not just “other income”.
- OPM recovery from -6% to +3%
- Revenue up 55% YoY, showing demand + pricing power rebound
5. Valuation
Valuation Multiples:
- P/E: 11.8x (trailing)
- P/B: 0.84x (stock is trading below book)
- EV/EBITDA: Hard to apply when EBITDA swings from -ve to +ve
Fair Value Range: ₹270 – ₹330
Assumptions:
- FY26E EPS: ₹25 (growth of ~20%)
- Multiple: 10x–13x based on peer median and asset backing
6. What’s Cooking – News, Triggers, Drama
Latest news:
- ₹136 Cr contingent liability (uh-oh)
- Earnings propped up by ₹30 Cr other income (uh-oh x2)
- Promoter holding has dropped from 56.78% → 50.99% over 3 years
Upcoming Triggers:
- Debt reduction (from ₹261 Cr to ₹51 Cr)
- Continued revenue growth from pharma clients
- New specialty packaging clients?
Drama rating: 7.5/10
7. Balance Sheet
| Metric | FY23 | FY24 | FY25 |
|---|---|---|---|
| Equity Capital | ₹11 Cr | ₹12 Cr | ₹12 Cr |
| Reserves | ₹273 Cr | ₹302 Cr | ₹326 Cr |
| Total Borrowings | ₹128 Cr | ₹70 Cr | ₹51 Cr |
| Investments | ₹156 Cr | ₹151 Cr | ₹140 Cr |
| Total Assets | ₹444 Cr | ₹413 Cr | ₹424 Cr |
Key Points:
- D/E Ratio improved significantly
- Steady increase in reserves
- High investment base (parking cash or strategic?)
8. Cash Flow – Sab Number Game Hai
| Metric | FY23 | FY24 | FY25 |
|---|---|---|---|
| CFO | ₹77 Cr | ₹21 Cr | ₹17 Cr |
| CFI | ₹89 Cr | ₹42 Cr | ₹3 Cr |
| CFF | -₹155 Cr | -₹74 Cr | -₹8 Cr |
| Net Cash | ₹11 Cr | -₹11 Cr | ₹12 Cr |
Highlights:
- FY23 saw massive positive cash flow—most of it invested
- FY24/FY25 back to normalcy
- No dividends despite profit—investors still waiting
9. Ratios – Sexy or Stressy?
| Ratio | FY23 | FY24 | FY25 |
|---|---|---|---|
| ROCE | 7% | 3% | 10% |
| ROE | 0% | 7% | 7.4% |
| Inventory Days | 128 | 102 | 75 |
| Debtor Days | 51 | 87 | 57 |
| Cash Conversion Cycle | 165 | 181 | 124 |
Interpretation:
- RoE still below industry norms, but improving
- CCC dropping = better ops mgmt
- ROCE bounce in FY25 is promising
10. P&L Breakdown – Show Me the Money
| Quarter | Revenue | Op Profit | Net Profit | OPM % |
|---|---|---|---|---|
| Mar ’24 | ₹111.76 Cr | ₹8.3 Cr | -₹4.83 Cr | 7.4% |
| Dec ’24 | ₹151.46 Cr | ₹9.10 Cr | ₹10.58 Cr | 6.0% |
| Sep ’24 | ₹100.27 Cr | -₹3.12 Cr | ₹6.86 Cr | -3.1% |
| Jun ’24 | ₹127.91 Cr | -₹1.1 Cr | ₹11.50 Cr | -0.86% |
- Quarterly profits are volatile, heavily dependent on “other income”
- OPM improving, but still fragile
11. Peer Comparison
| Company | CMP | P/E | ROE | OPM | Sales (TTM ₹ Cr) |
|---|---|---|---|---|---|
| Hindalco | ₹675 | 9.1x | 14.5% | 13.3% | ₹2.38L Cr |
| NALCO | ₹189 | 6.6x | 32.7% | 44.7% | ₹16,788 Cr |
| PG Foils | ₹242 | 11.8x | 7.4% | 2.6% | ₹491 Cr |
| MMP Ind | ₹287 | 18.7x | 12.7% | 9.2% | ₹692 Cr |
PG Foils is small, under-leveraged, and still in early innings compared to giants.
12. Miscellaneous – Shareholding, Promoters
| Category | Mar ‘23 | Mar ‘24 | Mar ‘25 |
|---|---|---|---|
| Promoters | 51.6% | 50.99% | 50.99% |
| Public | 48.4% | 49.01% | 49.01% |
| FII | 0.00% | 0.00% | 0.00% |
Red flag:
- Promoters reducing stake
- No FII/DII interest despite positive earnings
13. EduInvesting Verdict™
PG Foils is the kind of small-cap that looks boring—until you realize it supplies essential material to pharma majors and has swung from negative OPM to profitability again. It’s asset-rich, debt-light (finally), and trading at a discount to book value.
However…
- No dividend
- High contingent liabilities
- Promoters have trust issues (aka reducing stake)
Think of it as the tiffin foil of your portfolio: useful, lightweight, but definitely not meant to carry biryani on its own.
Metadata
Written by EduInvesting Research Team | Date: 18 July 2025
Tags: PG Foils, Small Cap, Aluminium Foil, Packaging, Pharma Suppliers, Value Picks, Financial Analysis, Manufacturing, Specialty Materials


