1. At a Glance – Helmet On, Valuation Tight
Msafe Equipments is walking into Dalal Street wearing a ₹66.42 crore IPO helmet, priced at ₹116–₹123, asking investors to trust a 39% EBITDA margin, 21% PAT margin, and a post-IPO P/E of ~11.95x. Not bad for a company born in 2019 that already supplies to 22 states & 3 UTs, runs 3 factories, 17 warehouses, and rents scaffoldings like Netflix rents dopamine.
Market cap clocks in at ₹250.92 crore, promoters dilute from 100% to 73.53%, and retail investors need to cough up ₹2.46 lakh minimum. This is SME land—no pocket change, no mercy.
Is this a disciplined height-safety play or margins doing parkour without a harness? Let’s climb carefully.
2. Introduction – A Young Company Climbing Fast (Maybe Too Fast?)
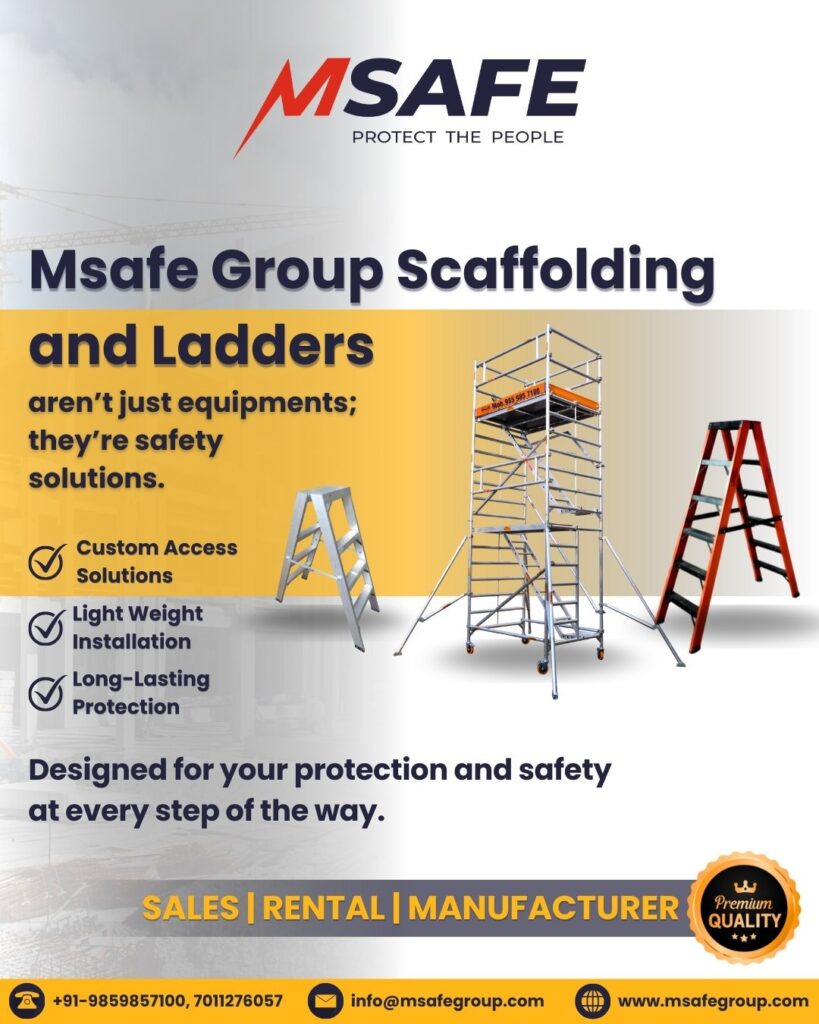
Msafe Equipments manufactures and rents access & height-safety equipment—scaffoldings, ladders, FRP solutions—basically everything that lets humans defy gravity legally.
Founded in 2019, the company has grown fast, posting PAT of ₹13.01 crore in FY25 on ₹71.62 crore income. That’s solid growth, but also eyebrow-raising margins in a fragmented, competitive, price-sensitive industry.
The IPO money is earmarked for capacity expansion, rental equipment capex, and working capital. Translation: more metal, more ladders, more rental cycles, more cash stuck in inventory.
The big question: Are these margins sustainable once competition wakes up and depreciation hits harder? Or is this one of those “enjoy the numbers before gravity returns” stories?
3. Business Model – WTF Do They Even Do?
Msafe operates in three avatars:
- Manufacturing – aluminium & MS scaffoldings, ladders, FRP products
- Sales – outright product sales to contractors, infra players, HVAC, MEP guys
- Rental – recurring revenue via short-term and long-term equipment rentals
Rental is the sexy part—repeat usage, sticky clients, higher margins. But it also means capital intensity, maintenance, logistics, and asset churn risk.
They’ve built 17 warehouses to support this rental model. That’s impressive scale for a 6-year-old company—but also means fixed costs don’t forgive slowdowns.
If you’re explaining this to a lazy investor:
“They sell and rent ladders and scaffoldings to people who don’t want to fall and risk their live”.
Simple. Effective. Competitive as hell.
4. Financials Overview – Numbers That Flex
Financial Comparison Table (₹ Crore)
| Metric | Sep 30, 2025 | Sep 30, 2024* | Mar 31, 2025 | YoY % | QoQ % |
|---|---|---|---|---|---|
| Total Income | 49.07 | ~34.8 | 71.62 | Strong | – |
| EBITDA | 19.21 | ~12.8 | 26.08 | Strong | – |
| PAT | 10.50 | ~6.3 | 13.01 | Strong | – |
| EPS (₹) | ~5.15 | ~3.2 | 8.13 | ↑ | – |
*Prior half-year approximated for comparison only.
Witty takeaway:
Margins look like they’re doing yoga—flexible and suspiciously calm. EBITDA margin near 40% in scaffoldings? Either management is brilliant… or competition hasn’t arrived yet.
5. Valuation Discussion – Fair Value Range Only
Method 1: P/E Multiple
- Post-IPO EPS: ₹10.29
- Reasonable SME multiple range: 10x – 14x
- Fair Value Range: ₹103 – ₹144
Method 2: EV / EBITDA
- FY25 EBITDA: ₹26.08 Cr
- EV/EBITDA range: 6x – 8x
- Implied
