Laxmipati Engineering Works Ltd H1 FY26: ₹2,844 lakh Revenue, ₹288 lakh PAT, 122% ROE — Heavy Engineering or Heavy Drama?
1. At a Glance – Blink and You’ll Miss the Volatility
Laxmipati Engineering Works Ltd is that SME stock which quietly sits at a ₹200 crore market cap, flexing a ₹348 price tag, while casually dropping numbers that look like they belong to a Bollywood interval scene. The company clocked ₹28.6 crore quarterly sales and ₹2.88 crore quarterly PAT, which in SME land is enough to make WhatsApp groups spontaneously combust. The stock has delivered 45% returns over one year, yet managed a -6.37% return over the last three months, reminding everyone that timing is everything and patience is not optional. With a P/E of ~21.6, ROCE of 18.6%, and a frankly suspicious-looking ROE of 122%, this is not your sleepy PSU uncle. This is a leveraged, sweaty, fabrication-heavy business trying to cosplay as a capital-efficient marvel. The latest Half-Yearly Results (H1 FY26) lock the EPS logic firmly into half-year mode — no jugaad, no creative accounting gymnastics. The question is simple: is this a serious engineering turnaround story, or just a well-timed profit spike wearing a hard hat?
2. Introduction – From Shipbuilding Dreams to Fabrication Reality
Laxmipati Engineering Works Ltd started life in 2012 with ambitions of shipbuilding, which—like many Indian business dreams—quickly met reality, gravity, and bank interest rates. Over time, the company pivoted into fabrication, heavy engineering, shutdown maintenance, and manpower services, which is corporate speak for “we do the dirty, difficult, last-minute industrial work others avoid.”
This is not a glamorous SaaS company selling subscriptions with 90% gross margins. This is a nuts-and-bolts, crane-and-welding business, supplying manpower and fabrication services to sectors where delays cost crores per hour. Fertilizers, refineries, petrochemicals, oil & gas, power, aerospace, defence — basically every sector where helmets are mandatory and excuses are not tolerated.
But here’s where it gets interesting. For years, Laxmipati looked like a financial rollercoaster with negative profits, fluctuating margins, and debt creeping up like a bad habit. And then suddenly, FY25 and H1 FY26 arrive with profits, margins, and ROE numbers that make investors rub their eyes. Is this the result of operating leverage kicking in? Or just a cyclical upswing with perfect timing?
Before we crown it the next defence darling, let’s actually open the books and read them — slowly, sarcastically, and with suspicion.
3. Business Model – WTF Do They Even Do?
Imagine a large refinery shuts down a critical unit for maintenance. Every hour costs money. Every delay triggers emails, phone calls, and panic. This is where Laxmipati shows up with welders, fabricators, cranes, and manpower — like industrial firefighters.
The company earns most of its revenue from manpower supply and fabrication services. It does not design fancy IP-heavy products. Instead, it executes contracts where timely delivery and technical capability matter more than branding.
Industries Served:
Fertilizer & Chemicals
Refineries & Petrochemicals
Oil & Gas
Thermal & Nuclear Power
Aerospace & Defence
Revenue is split 60% defence-related and 40% heavy engineering, which explains why investors suddenly started paying attention once defence spending became the new national obsession.
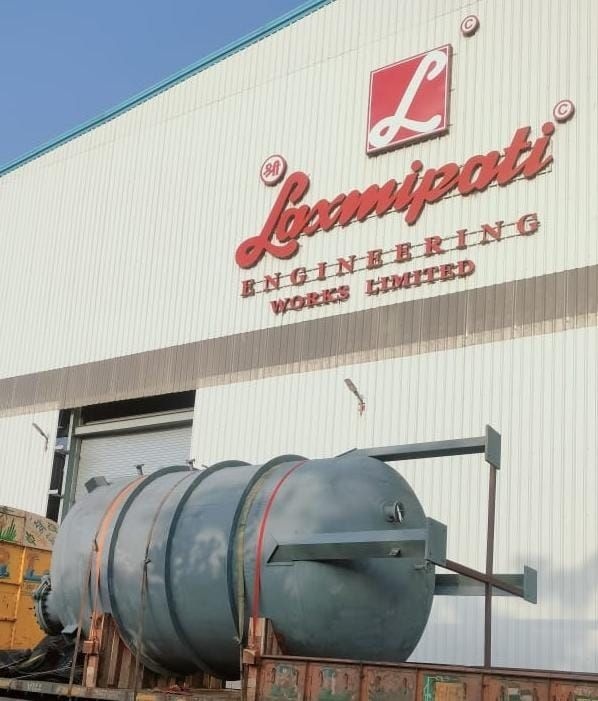
The company operates out of a ~40,000 sq. meter facility at Palsana, Gujarat, equipped with heavy machinery — 30 MT EOT cranes, CNC cutting machines, VMCs, pipe bending machines, welding infrastructure, the whole industrial buffet.
Capacity utilisation, however, tells a less heroic story:
FY22: 40%
FY23: 30%
So yes, the plant exists. Yes, the machines are shiny. But they’re not exactly sweating at full capacity yet. Which raises a question: if margins are already this high at low utilisation, what happens if volumes actually scale?
4. Financials Overview – The Numbers That Changed the Mood
Result Type Locked: HALF-YEARLY RESULTS (H1 FY26) EPS Annualisation Rule Applied: Latest EPS × 2
Financial Comparison Table (₹ crore)
Source table
Metric
Latest Quarter (Sep 2025)
Same Qtr LY
Prev Qtr
YoY %
QoQ %
Revenue
28.61
17.48
26.50
63.7%
8.0%
EBITDA
6.29
2.56
7.13
145.7%
-11.8%
PAT
2.88
0.12
6.41
2300%+
-55.1%
EPS (₹)
5.01
0.21
11.14
2285%
-55.0%
Yes, the YoY numbers look insane because last year’s base was basically on life support. QoQ moderation reminds us this is still a cyclical execution business, not a SaaS