1. At a Glance
Knowledge Marine & Engineering Works Ltd (KMEW) is the rare kind of engineering firm that actually floats — literally. While most smallcaps are busy “navigating” uncertain markets, these folks are navigating actual rivers, ports, and now electric seas. With a market cap of ₹3,351 crore and a current share price of ₹2,742 (as of 21 Nov 2025), KMEW is sitting pretty at a P/E of 68x — because why settle for a grounded valuation when your business runs on water?
In Q2 FY26, the company clocked ₹50.17 crore in sales and ₹11.89 crore in PAT — down 4.4% and 10.9% respectively QoQ. But, before anyone panics, note this: they have an insane ₹733 crore order book, a fresh ₹384 crore electric tug contract, and MoUs worth ₹1,560 crore waiting to turn into business. The promoter holding has dipped to 53.6%, but foreign investors (especially the “Infinity” gang) are literally pouring money in like it’s Diwali bonus season.
And with a 24.7% ROCE and 25.8% ROE, KMEW isn’t just afloat — it’s speeding past the rest of the Indian maritime sector like River Pearl on nitrous oxide.
2. Introduction
Imagine you’re running a business where your “machinery” floats, your “factories” are rivers, and your “production line” involves mud. Welcome to Knowledge Marine & Engineering Works Ltd — the Mumbai-based company turning dredging (that thing everyone ignores) into a ₹3,000 crore market story.
KMEW started in 2015, and in less than a decade, it has become the poster child for Indian marine engineering. From building tugs to dredging ports to repairing boats, they’ve turned every aquatic headache into a profitable contract. Their client list is like a who’s who of Indian ports: Haldia, Paradip, Vizag, Mumbai — you name it, they’ve billed it.
The company’s recent headlines are pure Bollywood drama. A ₹384 crore electric green tug contract (because even ships need EVs now), ₹1,560 crore MoUs signed during India Maritime Week, and a ₹450 crore Bahrain sand-mining project. If dredging had a red carpet, KMEW would be walking it in a hard hat and gumboots.
Still, the real story isn’t just in contracts. It’s in how this 2015-born company managed to make dredging — once considered boring port maintenance — into a high-ROE, high-growth smallcap darling.
3. Business Model – WTF Do They Even Do?
Let’s break it down. Knowledge Marine & Engineering Works Ltd basically makes money in three ways — dredging, building/owning marine crafts, and repairing marine infrastructure.
a) Dredging:
Think of dredging as underwater vacuuming — removing sand, rock, or silt to keep ports and waterways deep enough for ships. It’s messy, expensive, and completely unavoidable for any port. And that’s why KMEW loves it. About 94% of their FY24 revenue comes from dredging.
b) Owning & Chartering Marine Crafts:
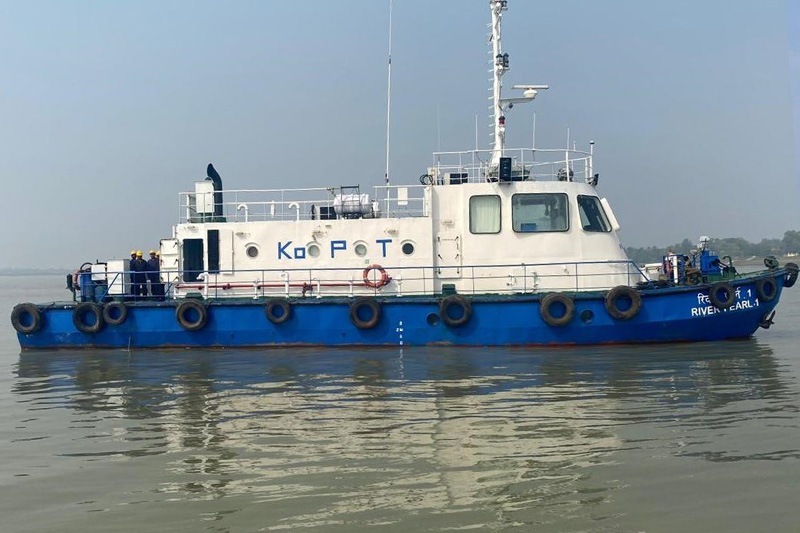
They own an army of boats named River Pearl 1 to River Pearl 12, plus a few newer stars. These vessels get hired by ports for patrolling, piloting, mooring, and tugging. Basically, if it floats and works at a port, KMEW probably rents it out.
c)
Ship Building & Repairs:
They also design and refit boats, tugs, and other vessels. It’s like running a car garage, except the vehicles weigh 200 tons and float on saltwater.
The New Frontier:
They’re now getting into Cutter Suction Dredgers, sand mining, dam desiltation, and even fishing harbours. Why stop at ports when you can own the riverbed too?
If you think this is a simple dredging company, think again — they’re now building the country’s first electric tug. The only thing missing is a Netflix series: “Mud, Metal & MoUs – The KMEW Story.”
4. Financials Overview
| Metric | Latest Qtr (Sep’25) | Same Qtr Last Year (Sep’24) | Previous Qtr (Jun’25) | YoY % | QoQ % |
|---|---|---|---|---|---|
| Revenue | ₹50.17 Cr | ₹52.47 Cr | ₹48.12 Cr | -4.4% | 4.3% |
| EBITDA | ₹20.07 Cr | ₹20.06 Cr | ₹20.13 Cr | 0.0% | -0.3% |
| PAT | ₹11.89 Cr | ₹13.35 Cr | ₹10.88 Cr | -10.9% | 9.3% |
| EPS (₹) | 10.37 | 11.64 | 10.43 | -10.9% | -0.6% |
Commentary:
Quarter-on-quarter, the business looks like it took a coffee break, but remember — dredging contracts are lumpy. One month you’re scooping mud, next month you’re building tugs. Despite a dip in PAT, margins stayed rock solid near 40%. And at ₹10.37 EPS, the annualized number hits ₹41.5 — translating to a P/E of around 66x. Not cheap, but hey, you’re paying for a company that literally builds the sea floor.
5. Valuation Discussion – Fair Value Range
Let’s do some quick math, without diving into the Mariana Trench.
P/E Method:
EPS (TTM): ₹45.6
Industry P/E: 68x
Fair value = ₹45.6 × (55–70) = ₹2,508 – ₹3,192
EV/EBITDA Method:
EV/EBITDA (current) = 39.8x
If we assume a sustainable range of 25–35x (for steady growth + contract visibility),
Fair EV = 25 × 81 = ₹2,025 Cr → Per share ~₹1,600
Fair EV = 35 × 81 = ₹2,835 Cr → Per share ~₹2,250
DCF Snapshot (simplified):
With OCF growth around 30% and discount rate 10%, terminal value yields ₹2,500–₹3,000 range.
📘 Educational Disclaimer:
This fair value range is purely for educational and analytical purposes. It is not investment advice.
6. What’s Cooking – News, Triggers, Drama
2025 has been a blockbuster for KMEW:
- ₹384.33 Cr Green Tug Contract: A 15-year hire