1. At a Glance
Khaitan Chemicals & Fertilizers Ltd (KCFL) – India’s undisputed king of Single Super Phosphate (SSP) fertilizers – has turned its Q2FY26 into a sizzling chemical reaction. With revenue shooting to ₹309 crore and PAT bubbling at ₹21.5 crore, this Madhya Pradesh-based fertilizer veteran is proving that even after four decades in the soil business, it still knows how to cook up a profitable quarter.
At a market cap of ₹829 crore and a current price of ₹85.3, the company’s stock looks like it’s still warming up after a chemical hangover. An 800% YoY profit surge looks juicy, but the same line also hides a history of volatility that’d make even a lab thermometer nervous. ROE is 0.63%, ROCE 2.48%, and debt-to-equity sits at a manageable 1.07. EPS for the latest quarter stands at ₹2.21, translating to an annualized ₹8.84 – giving a P/E of roughly 9.6, which in fertilizer-world terms, is like spotting urea in a desert: rare and surprisingly fair.
After a turbulent FY24 where negative profits and subsidy delays dented performance, the Q2FY26 rebound screams one thing: “Subsidy aa gaya!” Now, the only question – can the smell of success last longer than sulphur fumes?
2. Introduction – When Life Gives You Sulphur, Make SSP
Khaitan Chemicals is that old-school uncle at the agro party – not flashy like Coromandel, not government-backed like RCF, but always dependable, showing up with fertilizers when the monsoon hits right. Born in 1982, KCFL has seen the Indian fertilizer market evolve from bullock carts to subsidy portals, and yet, the essence remains the same: sell more SSP, collect subsidy faster than your competitors, and pray the government doesn’t “recalculate” anything mid-season.
FY25 was a volatile year – think acid spills and oilseed crashes – but FY26 started smelling sweeter. The agro division was officially sold off (finally putting an end to the soy-oil misery that’s been simmering since 2020), leaving KCFL laser-focused on its core: fertilizers and chemicals.
And boy, did that focus pay off! Revenue climbed to ₹309 crore in Q2FY26, a strong 33.8% jump QoQ, while net profit skyrocketed 800% YoY to ₹21.5 crore. In chemical terms, that’s like turning lead into sulphuric gold.
But before we crown them the “Sulphate Sultan of India,” remember: the fertilizer game is government-scripted. A late subsidy or input price swing can make even the best operators look like they’re juggling acid in the rain.
3. Business Model – WTF Do They Even Do?
Let’s simplify this — Khaitan Chemicals runs on three cylinders:
1. Fertilizers (The Superstar)
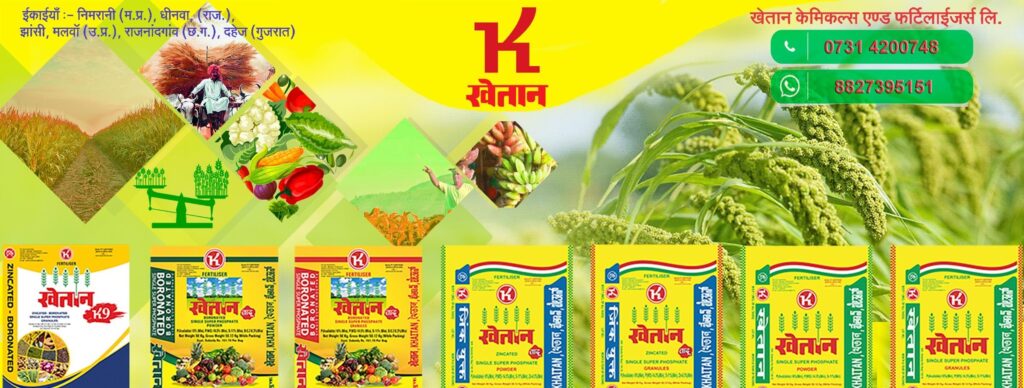
They make and sell Single Super Phosphate (SSP), the OG fertilizer before NPKs and urea got fancy. The company produces it in plain, zincated, and boronated forms (both powder and granules). If you’ve ever seen a farmer in Madhya Pradesh smiling after sowing, chances are his soil’s got a Khaitan touch.
2. Chemicals (The Sidekick with a Bite)
Sulphuric acid, oleum, and other chemical by-products make up the secondary stream. With a capacity of 2.71 lakh MT per year, their plants run hot and heavy – often feeding
both in-house SSP needs and external buyers.
3. Power Generation (Because Steam Never Dies)
In classic “waste-not” fashion, the company uses process steam to generate 4.3 MW of captive power and even runs a 1.25 MW windmill in Maharashtra.
Recently, KCFL exited its Agro/Oil division, citing poor margins and idle assets. Honestly, good riddance — the soybean business was dragging their chemistry down.
Today, Khaitan’s empire runs across 6 plants in MP, UP, Rajasthan, Chhattisgarh, and Gujarat — a total SSP capacity of 11.14 lakh MT and a loyal dealer base of 3,000+. It’s basically the Maruti of SSP.
4. Financials Overview
| Metric (₹ Cr) | Q2FY26 (Sep’25) | Q2FY25 (YoY) | Q1FY26 (Jun’25) | YoY % | QoQ % |
|---|---|---|---|---|---|
| Revenue | 309 | 231 | 234 | 33.8% | 32.0% |
| EBITDA | 31 | 9 | 32 | 244.4% | -3.1% |
| PAT | 21.5 | 2.4 | 21 | 796% | 2.4% |
| EPS (₹) | 2.21 | 0.25 | 2.21 | 784% | 0% |
Commentary:
That’s not just a turnaround, that’s a lab explosion of profitability. From a near-loss situation a year ago to ₹21 crore PAT now — KCFL looks like it’s finally stabilizing after years of unpredictable performance. The quarterly OPM of 10% is respectable in the fertilizer world, especially given how input costs (sulphur, rock phosphate) fluctuate faster than political manifestos.
5. Valuation Discussion – The Fair Value Lab Experiment
Let’s try three approaches for fun — and education, of course.
(a) P/E Method:
Current EPS (TTM): ₹6.61
Industry P/E: 22.7
KCFL P/E: 12.9
If we assign a conservative multiple of 10–15x (given its volatility):
Fair Value Range = ₹66 to ₹99 per share
(b) EV/EBITDA Method:
EV = ₹1,094 crore
EBITDA (TTM) = ₹84 crore
EV/EBITDA = 13x (vs. industry median ~10x)
So fair value = ₹85–₹95 range
(c) DCF Method (simplified):
Assuming modest 8% growth, 10% WACC, stable margins, fair range emerges near ₹80–₹100.
✅ Fair Value Range (Educational Only): ₹70 – ₹100 per share
Disclaimer: This fair value range is for educational purposes only and is not investment advice.
6. What’s Cooking – News, Triggers, Drama
November 2025 was a spicy month in Khaitan-land. Promoter group Majestic Packaging went shopping, buying 60,000 shares in open market and bumping stake to 22.82%. Overall promoter holding ticked up to 72.64%. Nothing says “we still

