1. At a Glance
JTL Industries rolls out the backbone of India’s infrastructure—steel tubes and hollow sections. With a 5-year sales CAGR of 53%, they’ve scaled up fast. But now, margins are compressing, profits are declining, and working capital is going on a jungle safari.
2. Introduction with Hook
Imagine a steel pipe so smooth it could slide right through your profit and loss account—and take your margins along for the ride. That’s JTL right now. A poster child of SME growth stories in FY22, it’s now dealing with the weight of its own expansion.
- Stock down 28% YoY
- FY25 PAT fell 13%
- Capex ballooned to ₹63 Cr in CWIP
- ROCE dropped to 13% from 32%
The product is strong. But is the balance sheet getting hollow?
3. Business Model (WTF Do They Even Do?)
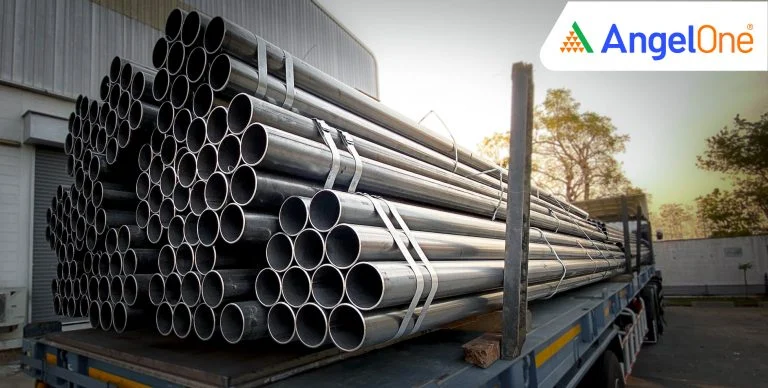
JTL is in the business of Electric Resistance Welded (ERW) pipes and hollow steel sections. Translation? They make those versatile, high-strength tubes you see in everything from stadiums to scaffolding.
Segments:
- MS Black Pipes
- Square, Rectangular, and Circular Hollow Sections
- Custom steel profiles
Applications:
- Infrastructure
- Solar panel frames
- Construction
- Liquid transport systems
Clients range from EPC players to developers and infra giants. High volume, moderate margin biz with aggressive scale-up plans.
4. Financials Overview
| FY | Revenue (₹ Cr) | OPM | PAT (₹ Cr) | EPS | ROE |
|---|---|---|---|---|---|
| FY22 | 1,355 | 7% | 61 | 2.6 | 40% |
| FY23 | 1,547 | 8% | 90 | 2.7 | 32% |
| FY24 | 2,039 | 7% | 113 | 3.3 | 23% |
| FY25 | 1,913 | 6% | 99 | 2.6 | 10% |
Growth’s slowing, margins tightening, profits slipping. Even their own tubes wouldn’t bend under pressure like this.
5. Valuation
At ₹81.6/share:
- P/E: 37.2x
- Book Value: ₹31.9
- CMP/BV: 2.56x
- Market Cap: ₹3,121 Cr
🧮 Fair Value Range:
- Based on sustainable EPS of ₹2.2 and P/E range of 25–30x: ₹55 – ₹66
- EV/EBITDA multiple of 12–15x on FY25 EBITDA: ₹60 – ₹70
The market’s still valuing it like it’s growing at 30%. Reality check: it’s currently paddling at 5%.
6. What’s Cooking – News, Triggers, Drama
- Q1 FY26 PAT at ₹16.5 Cr, down 48% YoY
- Massive CWIP at ₹63 Cr = Capex mode
- Increasing investor count = rising retail interest
- Promoter stake stable at 48.91%
- Conference call scheduled post results
Potential Triggers:
- Demand rebound in infra
- Solar-related steel products
- New plant utilization
- Inventory flush-out
But for now? Numbers look rust-coated.
7. Balance Sheet
| Metric (₹ Cr) | FY25 |
|---|---|
| Equity Capital | ₹39 |
| Reserves | ₹1,179 |
| Borrowings | ₹53 |
| Fixed Assets | ₹189 |
| CWIP | ₹63 |
| Total Assets | ₹1,315 |
Key notes:
- Capex-intensive expansion visible
- Borrowings remain under control
- Book Value rising, but slower than equity dilution
8. Cash Flow – Sab Number Game Hai
| FY | CFO | CFI | CFF | Net Cash |
|---|---|---|---|---|
| FY25 | -₹215 Cr | -₹210 Cr | ₹384 Cr | -₹41 Cr |
| FY24 | -₹24 Cr | -₹90 Cr | ₹171 Cr | ₹57 Cr |
| FY23 | ₹7 Cr | -₹23 Cr | ₹66 Cr | ₹50 Cr |
Translation:
- Negative operating cash flow in FY25
- Heavy investment cash outflows
- Massive reliance on financing activities (likely equity)
Healthy? No. Expansion-heavy? Absolutely. Sustainable? Let’s see.
9. Ratios – Sexy or Stressy?
| Metric | FY25 |
|---|---|
| ROCE | 13.2% |
| ROE | 9.9% |
| Debtor Days | 52.8 |
| Inventory Days | 43 |
| CCC | 91 |
| WC Days | 157 |
Interpretation:
- ROCE halved from 32% in FY23
- Working capital spiked (bad sign)
- Debtor + inventory days slowly climbing = cash trap?
10. P&L Breakdown – Show Me the Money
| FY | Revenue | OPM | PAT | EPS |
|---|---|---|---|---|
| FY23 | ₹1,547 Cr | 8% | ₹90 Cr | ₹2.67 |
| FY24 | ₹2,039 Cr | 7% | ₹113 Cr | ₹3.28 |
| FY25 | ₹1,913 Cr | 6% | ₹99 Cr | ₹2.59 |
Flat-to-declining performance despite scale? That’s not the compounding story the street signed up for.
11. Peer Comparison
| Company | P/E | ROE | OPM | ROCE | M-Cap |
|---|---|---|---|---|---|
| APL Apollo | 62.9 | 19.4% | 5.8% | 22.8% | ₹47,649 Cr |
| Jindal Saw | 9.9 | 13.7% | 16.6% | 19.4% | ₹14,600 Cr |
| Ratnamani | 36.6 | 16.0% | 15.9% | 21.6% | ₹19,827 Cr |
| JTL | 37.2 | 9.9% | 5.4% | 13.2% | ₹3,121 Cr |
Verdict:
JTL is priced like Ratnamani but performing like Jindal Saw on a bad day. Needs margin revival ASAP.
12. Miscellaneous – Shareholding, Promoters
| Shareholder | % (Jun 2025) |
|---|---|
| Promoters | 48.91% |
| FIIs | 4.44% |
| DIIs | 3.36% |
| Public | 43.28% |
| Shareholders | 85,584 |
- Promoter dilution seen over 3 years
- FII entry grew from 0% → 4.4%
- Public love is high, but sentiment can flip fast
13. EduInvesting Verdict™
JTL looked like the next APL Apollo in FY22. Today, it’s struggling to justify its P/E multiple. Growth is still there, but margins are thinning, debt is sneaking back, and cash flows are gasping. The structural story is sound—but the execution needs tightening.
If the new capex doesn’t deliver stronger earnings soon, this will feel like a hollow bet—literally.
Metadata
– Written by EduInvesting Research | 16 July 2025
– Tags: JTL Industries, ERW Pipes, Steel Stocks, Midcap Infra, High Capex, Working Capital Stress


