Search for stocks /

Josts Engineering: 118 Years Old, ₹238 Cr Sales & Still Lifting More Than Gym Bros


1. At a Glance

Founded in 1907 (yes, before Bollywood existed), Josts Engineering is in the material handling and engineered products game. From forklifts to crash-testing sensors, they do it all. Current market cap? ₹379 Cr. Current stock price? ₹360 (down -26% in 1 year). Current vibe? “Old uncle but still flexing muscles at the akhada.”


2. Introduction

Josts is like that relative who’s been around forever but keeps reinventing themselves—sometimes as forklift king, sometimes as crash-test dummy supplier, sometimes as scientific lab vendor. With clients ranging from DRDO to Maruti to Tata Power, they’ve got credibility.

But here’s the twist: despite a solid order book (~₹219 Cr in Q1 FY26), their Q1 profits just collapsed 84%. Imagine working all year and still ending up with pocket money.

Still, you can’t ignore the long-term growth story—15–24% sales CAGR, 38%+ profit CAGR over 5 years, ROE >25%. Basically, boring-looking company, sexy numbers (except the latest quarter which looks like a hangover).


3. Business Model (WTF Do They Even Do?)

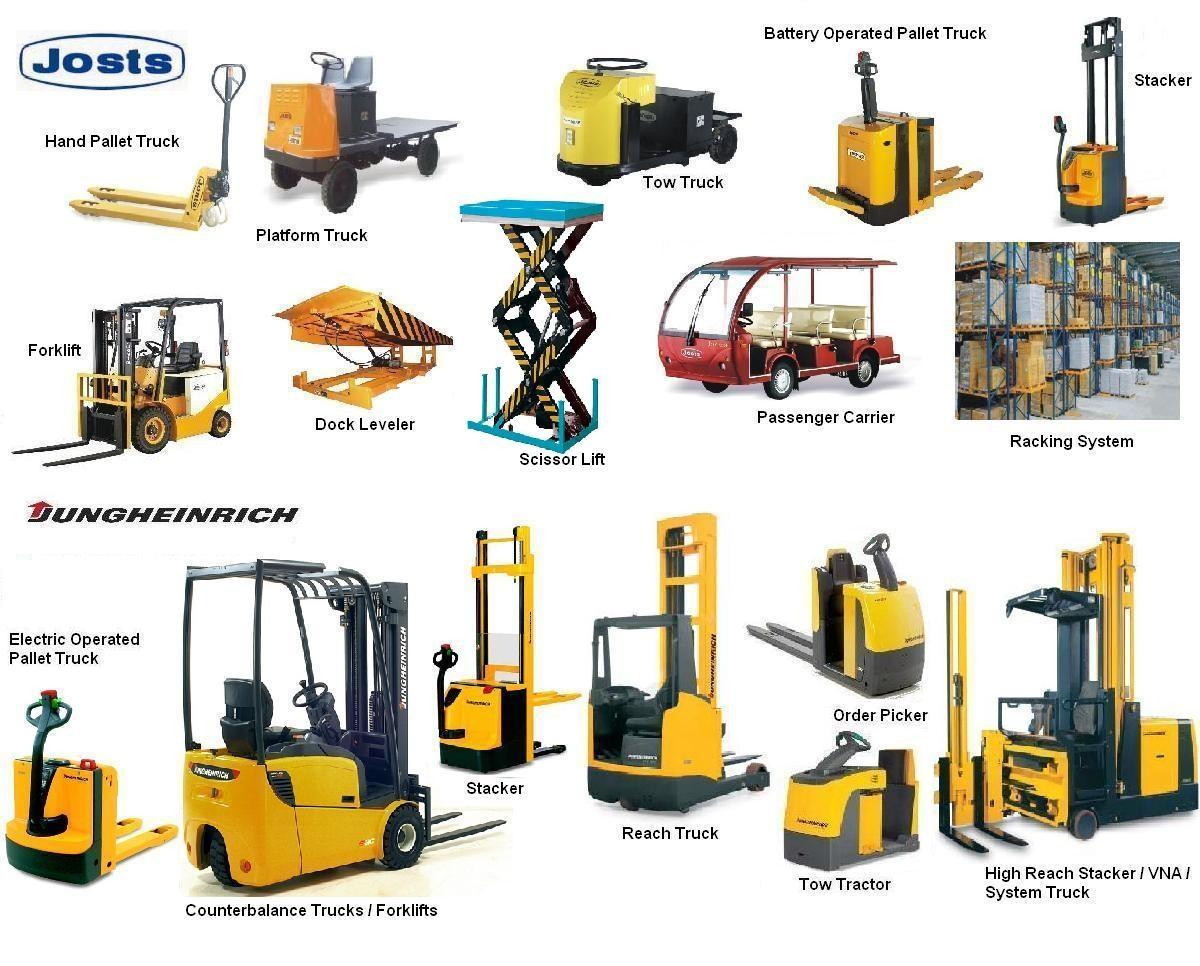
Josts splits its life between three divisions:

  • Material Handling Division (58%) – Forklifts, stackers, articulated lifters. If it lifts, they make it.
  • Engineered Products Division (34%) – Tech toys: vibration analyzers, crash-testing rigs, hydrogen sensors, nano-tech stuff. Basically, sci-fi engineering sold to DRDO, NTPC, Reliance.
  • MHE Rentals (8%) – Renting forklifts + operators. Because not everyone can afford to own.

New products? Electric forklifts, smart meter benches, hydrogen sensors. Sounds futuristic enough to attract ESG investors.


4. Financials Overview

Quarterly Snapshot (Q1 FY26 vs Q1 FY25 vs Q4 FY25):

Source table
MetricQ1 FY26 (₹ Cr)Q1 FY25 (₹ Cr)Q4 FY25 (₹ Cr)YoY %QoQ %
Revenue55.656.467.9-1.5%-18.0%
EBITDA3.45.87.2-41.4%-52.8%
PAT0.323.64.6-91.2%-93.0%
EPS (₹)0.273.143.88-91.4%-93.0%

Annualised EPS = ~₹1.1 → P/E looks insane. But FY25 EPS was ₹12.1, so this quarter is more of a pothole than a roadblock.


5. Valuation (Fair Value RANGE only)

Method 1: P/E
EPS (FY25) = ₹12.1. Industry P/E ~ 35–37.
Fair Value = ₹310 – ₹445.

Method 2: EV/EBITDA
EBITDA FY25 ~ ₹29 Cr. EV/EBITDA range 12–15x.
EV = ₹350 – ₹435 Cr → FV = ₹300 – ₹370.

Method 3: DCF (10% growth, 10% WACC)
FV Range ~ ₹320 – ₹420.

Consolidated FV Range: ₹300 – ₹445
(Educational only. Not investment advice.)


6. What’s Cooking – News, Triggers, Drama

  • Order Book: Strong at ₹219 Cr (almost equal to FY25 revenue). Future looks better than current quarter.
  • Subsidiaries:
    • USA sub (Jost’s Inc.) – not yet active, but could be a gateway abroad.
    • JECL Engineering Ltd – building a new plant at
error: Content is protected !!