Gretex Industries Ltd Q2 FY26 — ₹14.61 Cr Quarterly Revenue, ₹0.96 Cr PAT, Yet 130× P/E: A Music Distributor Priced Like a Rockstar
1. At a Glance
Gretex Industries Ltd is the kind of company that sells keyboards, microphones, and studio monitors… while the stock market sells the idea that it’s the next big hit single. As per the latest available snapshot, the stock is around ₹190 (close: 23 Dec 2025) with a market cap of ~₹295 crore. The price has been moody lately—about -4.52% over 3 months and -18.4% over 6 months, while long-term holders still get to brag about ~126% over 3 years and ~88.2% over 5 years. Operationally, the latest quarter shows ₹14.61 crore revenue and ₹0.96 crore PAT, with quarterly sales growth of ~53.9% and quarterly profit growth of ~186% (as displayed in the snapshot). The balance sheet looks clean-ish with debt ~₹1.07 crore and debt-to-equity ~0.02, but the valuation has no chill: Stock P/E ~130, Price-to-book ~5.66, and EV/EBITDA ~86. So the detective in me has only one question: is the market hearing a symphony of future growth, or just clapping because the speakers are loud?
2. Introduction
Let me set the scene. You walk into a music store. The guitars look shiny, the keyboards are begging for a Bollywood riff, and the microphones are basically waiting to be screamed into by someone starting a podcast called “Hustle & Haldi.” Now imagine the company behind the distribution of a chunk of this gear—especially in Eastern and North-Eastern India. That’s Gretex Industries.
Incorporated in 2009, Gretex is in the trading of musical instruments. Not manufacturing. Not composing. Just the distribution grind: bringing global brands to local markets, managing dealers, pushing inventory, and collecting payments without losing your sanity (or your receivables).
It claims to be the sole authorized distributor for musical instruments, professional audio and audio-visual products in Eastern and North-Eastern India for globally renowned brands. The brand list includes Yamaha (sole distributorship started in 2013), plus names like Klark Teknik, Bugera, Tannoy, Turbosound, Televic, TC Electronic, TC Helicon, Christie, Atlona, Sennheiser, and more. Geography? A wide sweep: West Bengal, Sikkim, Assam, Meghalaya, Arunachal Pradesh, Mizoram, Nagaland, Manipur, Tripura, Bihar, Orissa, Jharkhand, etc. Dealer network? 300+ dealers across 12 states.
So why is this interesting? Because the company has posted growth, has very low debt, and still trades at a valuation that makes even the most optimistic music producer ask, “Bhai, budget kaun approve kar raha hai?” Before we jump to conclusions, let’s investigate properly. And yes—every number used below comes straight from the dump you shared.
3. Business Model — WTF Do They Even Do?
Gretex is basically a supply chain DJ. It doesn’t create the song; it ensures the song reaches the party.
What they sell
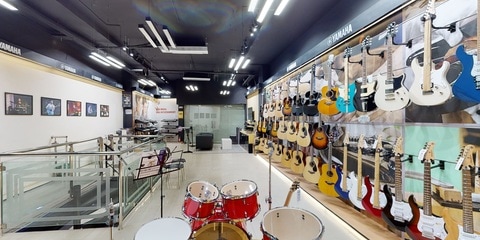
They stock a wide range of musical instruments and pro-audio gear and accessories—think sound cards, microphones, headphones, amplifiers, studio monitor speakers, loudspeakers, mixers, and more. Under brand buckets in your dump:
Yamaha: keyboards, pianos, drums, guitars, brass, woodwinds, violins, cello, vibraphones, and audio gear like headphones, studio monitors, portable PA systems, digital mixers.
D’Addario: instrument strings and accessories (guitars and more).
Harman: connected products and solutions including audio/visual products and connected systems.
Sennheiser: headphones, microphones, wireless systems, conference/information systems, plus aviation and audiology products.
How they make money
The revenue breakup shown for FY22: Sales ~98% and Other income ~2%. This is a distribution business—so margins are typically thin. Their OPM in the snapshot is ~2.63%. That is not a typo; that is the reality of trading businesses unless you have monopoly pricing power (which distributors rarely do).
Expansion flavour
They opened a Yamaha Music Store in collaboration with Yamaha on Feb 1, 2023, at Express Zone, Malad East, Mumbai. That’s an interesting move because retail can improve customer reach, but it also brings rent, staff, and operational complexity. Which direction does Gretex really want—pure distribution or retail expansion? What do you think: is retail a margin booster, or just a fancy way to increase fixed costs?
4. Financials Overview (Quarterly Results Locked)
Result type detected: “Quarterly Results” → EPS annualisation rule is locked as Quarterly. So, Annualised EPS = latest EPS × 4.
Now the fun part: sales and PAT look strong, but operating profit fell sharply vs both YoY and QoQ. How does PAT jump while EBITDA collapses? Here’s the clue from the same quarter data: Other income in Sep 2025 is ₹1.35 crore, compared to ₹0.64 crore in Sep 2024 and ₹0.40 crore in Jun 2025.
So yes, the company performed better on the bottom line, but a chunk of that quarter’s energy came from other income, not from operating muscle.
Also note the quarterly operating margins: OPM went from 3.04% (Jun 2025) to 1.03% (Sep 2025). That’s a margin faceplant. In a distribution business, small margin changes matter a lot.
Quick reader check: do you prefer a company where PAT rises because operations improve, or where other income saves the day?
5. Valuation Discussion — Fair Value Range Only (No “Buy/Sell” Drama)
We’ll use three methods: P/E, EV/EBITDA, and DCF. Numbers used are from your dump; assumptions (where necessary) are clearly labelled as assumptions.
The snapshot also shows Stock P/E ~130. That difference happens because the reported trailing EPS is influenced by the uneven profit profile across periods (FY24 had unusually high PAT driven by other income, and later periods normalised).
Fair value range via P/E (educational): If we apply a conservative P/E band of 25× to 45× to annualised EPS ₹2.60, then:
Lower: ₹2.60 × 25 = ₹65
Upper: ₹2.60 × 45 = ₹117
P/E fair value range: ₹65–₹117
B) EV/EBITDA Method (Step-by-step)
From the snapshot:
Enterprise Value (EV): ₹293 crore
EV/EBITDA: 86.0
That implies a trailing EBITDA (approx): EBITDA ≈ EV / (EV/EBITDA) = ₹293 / 86 ≈ ₹3.41 crore
Now, if a distribution business traded at a more normal EV/EBITDA band—say 15× to 25× (assumption band for sanity checks)—then implied EV becomes:
Lower EV: ₹3.41 × 15 ≈ ₹51.2 crore
Upper EV: ₹3.41 × 25 ≈ ₹85.3 crore
That’s drastically below current EV, which tells you one thing: the market is pricing in either a major EBITDA expansion, or it’s simply overenthusiastic.
C) DCF Method (Step-by-step, but with a warning label)
DCF needs free cash flows. From your cash flow table:
Cash from Operating Activity (FY25): ₹0.03 crore
Investing cash flow (FY25): -₹0.26 crore This implies cash flows are small and volatile. The snapshot also shows CMP/FCF: -104, indicating negative or messy free cash flow.
Still, for educational DCF mechanics, we can use FY25 operating cash flow ₹0.03 crore as a base (fact), and run scenarios with growth and discount rates (assumptions):
Assume:
Growth in cash flow: 10% to 20% (assumption range)
Discount rate: 14% to 18% (assumption range)
Terminal growth: 3% to 5% (assumption range)
Because the base cash flow is tiny, the DCF output becomes extremely sensitive and therefore not reliable. The practical conclusion: DCF is not the right tool here unless cash flows stabilise and scale. The valuation story is better discussed using earnings + operating metrics + balance sheet.
Overall educational fair value range conclusion: P/E-based sanity range: ₹65–₹117 (based on annualised EPS) EV/EBITDA also screams “priced for perfection.”
Disclaimer: This fair value range is for educational purposes only and is not investment advice.
So here’s a question: if the business is fundamentally a low-margin distributor, what exactly justifies “rockstar” valuation—future retail scale, new ventures, or market momentum?
6. What’s Cooking — News, Triggers, Drama (From Announcements)
Gretex has been busy in 2024–2025 with corporate actions and strategic moves:
7 Jan 2025: Entered a five-year wholesale supply agreement with Flipkart for musical instruments.
29 May 2025: Allotment of 6.91 lakh shares and 13.64 lakh warrants at ₹236 each on preferential basis.
11 Nov 2025: Board approved Q2/H1 results (ended Sep 30, 2025); issued 13,64,410 warrants aggregating ₹32.20 crore; investment in a new jewellery LLP.
19 Aug 2025 AGM: Approved MOA changes adding audio-visual and NBFC business activities; resolutions included auditor appointment, NBFC acquisition proposal, and limits increases.
22 Oct 2025: Ministry of Textiles sought recovery of ₹29,73,736 under RR-TUFS; company expects favourable outcome.
23 Dec 2025: Shareholders approved change in utilisation of preferential issue funds; 100% votes in favour.
19 Dec 2025: Entered leave & license to rent a godown in Pune (Phoenix Market City, Viman Nagar).