1. At a Glance
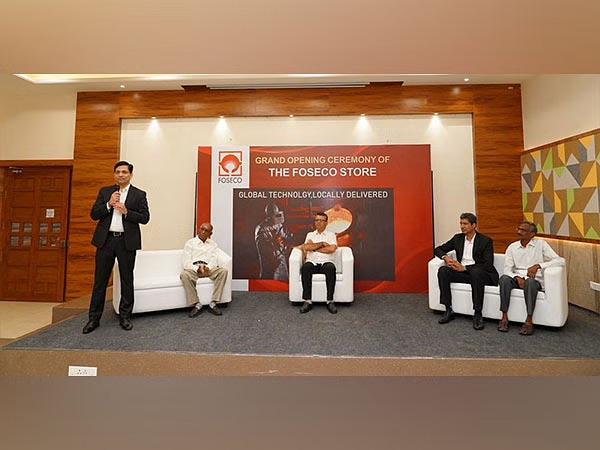
India’s only foundry consumables company with full-process coverage and zero debt. Sounds like a dream? Well, the margins are cast solid, but the valuation? That’s where the plot thickens (like molten metal in a leaky mould).
2. Introduction with Hook
If metallurgy had a Michelin star, Foseco India would be plating it. This company doesn’t just sell foundry products—it sells invisible magic that makes castings smoother, stronger, and sleeker. Think of it as the Fairy Godmother of molten metal.
But in the land of specialty chemicals and niche manufacturing:
- ROCE: 31.3%
- Dividend payout: 33.1%
- And yet… P/E of 40+?
We ask: Is Foseco quietly compounding, or loudly overvalued?
3. Business Model (WTF Do They Even Do?)
Foseco is not your run-of-the-mill steel company. It’s a metallurgical backstage pass.
Core Segments:
- Foundry Consumables: Exothermic sleeves, filters, coatings—used in casting.
- Ferrous & Non-Ferrous Metals: Works with aluminum, iron, steel—you name it.
- Process Control Systems: Automation tools for temperature & composition monitoring.
USP:
Only Indian player offering comprehensive solutions across the entire foundry value chain. Think of it as the Infosys of iron.
4. Financials Overview
| Year | Revenue (₹ Cr) | EBITDA (₹ Cr) | PAT (₹ Cr) | OPM % | EPS |
|---|---|---|---|---|---|
| CY21 | 338 | 44 | 33 | 13% | 51.15 |
| CY22 | 407 | 63 | 46 | 16% | 71.98 |
| CY23 | 477 | 70 | 73 | 15% | 114.27 |
| CY24 | 525 | 91 | 73 | 17% | 114.35 |
| TTM | 551 | 98 | 79 | 18% | 123.46 |
Highlights:
- Operating profits up 2.1x in 3 years.
- EPS doubled since CY21.
- Strong margin expansion with no debt fuel.
5. Valuation
At ₹5,020 a share and a P/E of ~41x, the stock is priced like a luxury alloy. Let’s deconstruct.
Method 1: P/E-Based
- EPS TTM = ₹123
- Reasonable Sectoral P/E = 25–30x
- Fair Value Range: ₹3,075 – ₹3,700
Method 2: DCF-lite
- FCF ~ ₹40 Cr/year
- Assuming 12–14% cost of capital
→ FV range: ₹3,000–₹3,400
Bottom Line: Great business. Priced like titanium in a gold wrapper.
6. What’s Cooking – News, Triggers, Drama
- Q1 FY25 earnings due July 29 – eyes peeled for volume growth.
- Resignation of HR Director (May 2025) – succession plans in motion?
- Dividend payout remains conservative (22% in CY24 vs avg 50%) – reinvestment mode?
- Capex Surprise: ₹143 Cr spent in investing activities in CY24 – possibly on tech, process automation.
And the company continues to gain foundry market share without shouting about it. Silent execution? We dig it.
7. Balance Sheet
| Metric | CY21 | CY22 | CY23 | CY24 |
|---|---|---|---|---|
| Equity | ₹6 Cr | ₹6 Cr | ₹6 Cr | ₹6 Cr |
| Reserves | ₹202 Cr | ₹233 Cr | ₹280 Cr | ₹337 Cr |
| Total Debt | Nil | Nil | ₹1 Cr | ₹2 Cr |
| Total Assets | ₹294 Cr | ₹345 Cr | ₹420 Cr | ₹483 Cr |
Key Points:
- Zero debt since pre-COVID.
- Reserves compounding at 20%+.
- Asset-light with just ₹45 Cr in fixed assets.
8. Cash Flow – Sab Number Game Hai
| Year | CFO | CFI | CFF | Net Cash Flow |
|---|---|---|---|---|
| CY21 | ₹20 Cr | -₹0 Cr | -₹6 Cr | ₹13 Cr |
| CY22 | ₹59 Cr | -₹3 Cr | -₹16 Cr | ₹40 Cr |
| CY23 | ₹57 Cr | -₹13 Cr | -₹26 Cr | ₹19 Cr |
| CY24 | ₹42 Cr | -₹143 Cr | -₹16 Cr | -₹117 Cr |
Ouch:
CY24 shows ₹143 Cr in investing outflows. Is this plant, R&D, or a secret foundry lair? Either way, monitoring capital allocation will be key.
9. Ratios – Sexy or Stressy?
| Metric | CY21 | CY22 | CY23 | CY24 |
|---|---|---|---|---|
| ROCE | 22% | 28% | 32% | 31% |
| ROE | 17% | 20% | 23% | 23% |
| Debtor Days | 80 | 76 | 78 | 84 |
| CCC (Days) | -13 | -37 | -36 | -23 |
Notes:
- Negative cash conversion cycle = chef’s kiss.
- Capital efficient, low working cap stress.
- Return ratios scream: “we know what we’re doing.”
10. P&L Breakdown – Show Me the Money
| Year | Sales | EBITDA | PAT | EPS | OPM % |
|---|---|---|---|---|---|
| CY21 | ₹338 Cr | ₹44 Cr | ₹33 Cr | ₹51.15 | 13% |
| CY22 | ₹407 Cr | ₹63 Cr | ₹46 Cr | ₹71.98 | 16% |
| CY23 | ₹477 Cr | ₹70 Cr | ₹73 Cr | ₹114.27 | 15% |
| CY24 | ₹525 Cr | ₹91 Cr | ₹73 Cr | ₹114.35 | 17% |
Steady ramp-up. EPS grew at 30%+ CAGR in 3 years, and margins expanded 400 bps. A specialty play done right.
11. Peer Comparison
| Company | CMP (₹) | P/E | ROCE | OPM % | EPS | Div Yield | CMP/BV |
|---|---|---|---|---|---|---|---|
| Foseco India | ₹5,020 | 40.7 | 31.3% | 17.7% | ₹123 | 0.49% | 9.3x |
| Deepak Nitrite | ₹1,944 | 38.0 | 16.6% | 13.2% | ₹51 | 0.38% | 4.9x |
| Vinati Organics | ₹1,984 | 49.5 | 20.6% | 26.0% | ₹40 | 0.35% | 7.3x |
| Atul Ltd | ₹6,923 | 41.8 | 12.8% | 16.4% | ₹165 | 0.35% | 3.6x |
Observation:
Foseco has:
- Highest ROCE
- Highest OPM (except Vinati)
- Smallest market cap → still a niche gem
- But, valuation multiple is bloated
12. Miscellaneous – Shareholding, Promoters
| Category | % Holding (Mar 2025) |
|---|---|
| Promoters | 74.98% (unchanged for years) |
| FIIs | 0.13% |
| DIIs | 0.57% |
| Public | 24.31% |
Interesting trend:
While institutions stay shy, public investor count is growing—from 10.8K to 13.5K in 2 years = retail likes it quiet and clean.
13. EduInvesting Verdict™
Foseco India is the silent overachiever of specialty industrials. No hype, no media blitz, just clean execution, expanding margins, and robust return metrics. It’s a lesson in how boring, low-glamour businesses can be absurdly profitable.
But here’s the caution:
When your P/E is 40+ in a cyclical, niche segment with limited scalability… you’re one bad quarter away from an 18% correction.
Verdict:
Steel yourself. This one’s premium-grade alloy—but you don’t want to buy it like it’s platinum.
Metadata
– Written by EduInvesting Research | 18 July 2025
– Tags: Specialty Chemicals, Foundry Tech, High ROCE Stocks, Zero Debt Stocks, Foseco India, Dividend Stocks, Industrial Niche Players


