1. At a Glance
Fineotex Chemical Ltd (FCL) just dropped its Q2 FY26 results and, as usual, it’s not the numbers alone that sparkle—it’s the entire “bonus party” the management threw for shareholders. Picture this: a ₹2,816 crore market cap company that makes specialty chemicals for textiles and hygiene, announces a 4:1 bonus, 2-for-1 share split, and a 40% interim dividend, all while staying completely debt-free.
At ₹24.6 per share (post-bonus price), FCL trades at a P/E of 28.6x, with an ROCE of 23.8% and ROE of 18.4%. The quarter clocked ₹13,771 lakh revenue (₹138 crore) and ₹2,608 lakh PAT (₹26 crore), though growth looked sleepy—YoY revenue down 5.5% and PAT down 18.4%. But before you judge, remember: Fineotex just doubled its capacity and expanded like a caffeinated polymer.
Debt? ₹0.03 crore (that’s basically pocket change). Cash? Plenty.
Promoter holding? 62.9%, unpledged, and looking smug.
In short—Fineotex is that nerdy topper who still gets pocket money.
2. Introduction
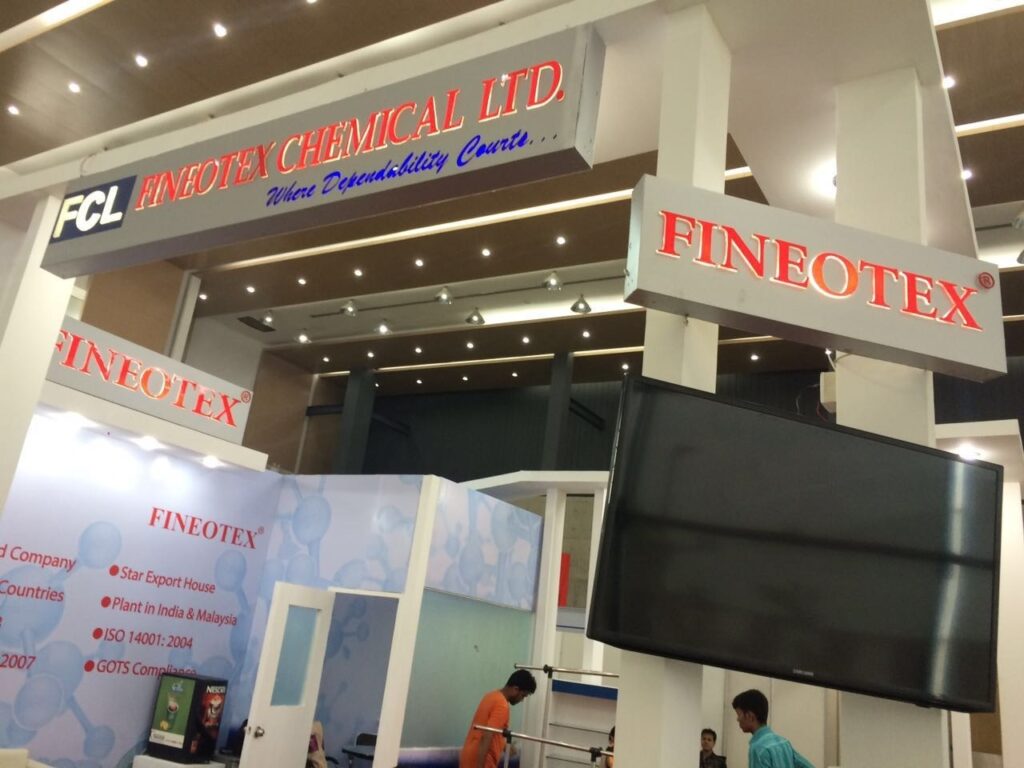
Incorporated in 1979, Fineotex started out making textile auxiliaries—those behind-the-scenes chemical formulas that give your T-shirts their stretch and your jeans their fade. Today, it’s evolved into a global multi-segment specialty chemical manufacturer, operating in textiles, oil & gas, water treatment, and FMCG hygiene.
While others in the chemical sector were chasing fluoropolymers and lithium dreams, Fineotex quietly built a ₹520 crore sales empire out of softeners, thickeners, and surfactants. You may not know the brand, but your clothes, detergents, and even mosquito repellents do.
The FY26 script reads like a Bollywood masala—new Ambernath plant, international expansion, ESG bragging, bonus shares, zero debt, and still, a mild profit dip. It’s like going to the gym, losing weight, and being criticized for not smiling enough.
But here’s the catch—Fineotex isn’t in the “commodity chemical” league. It’s in the “application-based formulation” business. Think less refinery, more recipe. It designs custom molecules for textile majors like Raymond, Welspun, and Vardhman, and even flirts with FMCG giants testing its new detergents.
So, does this eco-friendly chemical whisperer deserve a better valuation—or is it just another “bonus issue illusion”? Let’s unbox this chemical cocktail.
3. Business Model – WTF Do They Even Do?
Fineotex makes chemicals that make other products shine. Literally. Its portfolio of 470+ products serves industries from textiles to oil & gas, and FMCG hygiene to water treatment.
Here’s how their business divides:
1. Textile Chemicals (80% of revenue):
The OG business—covering pre-treatment, dyeing, printing, and finishing.
If a fabric looks vibrant, smooth, and doesn’t smell like your gym socks—it probably met Fineotex somewhere along the assembly line.
2. Oil & Gas Chemicals (4%):
A younger cousin—making performance chemicals like demulsifiers, biocides, and corrosion inhibitors. Not a huge slice yet, but gives them industrial legitimacy.
3.
FMCG & Hygiene (16%):
Home cleaners, hand-washes, dishwashing liquids—basically everything that keeps middle-class bathrooms Instagram-ready. This segment’s growth is catching eyes, especially with trial orders from FMCG majors.
4. Water Treatment Polymers:
A niche but rising business catering to industrial water purification. Given India’s water crisis, this could be their stealth rocket.
They sell to 70+ countries, backed by 103 dealers and 36 marketing engineers.
R&D runs through Biotex Malaysia, their innovation hub developing new-age textile finishes and even biotech mosquito repellents (yes, you read that right).
So yes—they make “auxiliaries,” but their range goes from the shirt you wear to the floor you mop. If chemicals had a Tinder profile, Fineotex’s bio would read: “Multi-purpose, eco-friendly, and low-maintenance.”
4. Financials Overview
| Metric (₹ Cr) | Q2 FY26 | Q2 FY25 | Q1 FY26 | YoY % | QoQ % |
|---|---|---|---|---|---|
| Revenue | 137.7 | 145.6 | 146.2 | -5.5% | -5.8% |
| EBITDA | 31.0 | 38.0 | 25.0 | -18.4% | +24.0% |
| PAT | 26.1 | 32.0 | 25.0 | -18.4% | +4.4% |
| EPS (₹) | 0.23 | 0.28 | 0.22 | -18.0% | +4.5% |
EPS annualized: 0.23 × 4 = ₹0.92 → P/E = 26.7x (fairly aligned with industry median).
Commentary:
Margins dipped a bit as the company integrated its new Ambernath facility. But note the consistency—Fineotex hasn’t posted a loss in over a decade. When others swing like volatile acids, Fineotex stays alkaline and calm.
5. Valuation Discussion – Fair Value Range
Let’s run three quick valuation views:
a) P/E Approach:
EPS (annualized) = ₹0.92
Industry median P/E ≈ 28.6x
→ Fair Value Range = ₹0.92 × 25–32 = ₹23–₹29.5
b) EV/EBITDA Approach:
EV = ₹2,768 crore
EBITDA (TTM) = ₹112 crore
EV/EBITDA = 24.7x → slightly above comfort.
Assuming fair multiple 18–22x → ₹2,016–₹2,464 crore EV = ₹18–₹22 per share
c) DCF Snapshot (Conservative):
5-year revenue CAGR = 13%, PAT margin ~20%, terminal growth 4%, discount rate 11%.
DCF range gives ₹22–₹28 per share.
🎯 Educational Fair Value Range: ₹22–₹29/share
Disclaimer: This fair value range is for educational purposes only and not investment advice. Real markets are more volatile than textile dyes.

