01 — At a Glance
The Gas Giant That Got Gassed. Right in the Margin.
- 52-Week High / Low₹638 / ₹175
- Q3 FY26 Revenue₹81.4 Cr
- Q3 FY26 PAT₹26.1 Cr
- TTM EPS₹7.18
- Annualised EPS (Q3 Avg × 4)₹7.44
- Book Value / Share₹65.4
- Price to Book3.03x
- Debt to Equity0.13x
- Total Installed Capacity3,691 TPD
- Return on Equity17.8%
Flash Summary: Ellenbarrie posted Q3 revenue of ₹81.4 crore and PAT of ₹26.1 crore, up 19.6% and 35.9% QoQ respectively. But wait—that profit jump was mostly because Q2 was artificially low. The real story: EBITDA margin collapsed from 38% (Q2) to 31% (Q3) because argon prices went on a 25% solo slide and steel got quiet. Management cheerfully explains it’s “temporary” while commissioning new plants worth ₹2,500+ crore and hunting for specialty gas contracts. Stock is down -61.8% from 52-week highs. The IPO glow from July 2025 is firmly in the rearview mirror.
02 — Introduction
The Little Indian Gas Guy That IPO’ed Like He Was Apple
Meet Ellenbarrie Industrial Gases. Established in 1973 — when dinosaurs roamed and Indian companies measured success by “not going bankrupt” — Ellenbarrie is now the largest 100% Indian-owned industrial gases company by installed capacity. That’s a flex in a market dominated by Linde (owned by Americans), Inox (owned by Americans), and Air Products (also Americans). India finally has a homegrown oxygen supplier that doesn’t need permission from Delaware.
On July 1, 2025, the company listed on NSE: ELLEN. Raised ₹852 crores. Fresh issue of ₹400 crores used to crush debt, fund capex, and “general corporate purposes” (the most Indian corporate term ever). The stock rocketed to ₹638 in early days. Now it’s ₹198, down 69% from the high. If IPO investors bought at the peak, they’re now learning what “opportunity cost” means by watching their portfolio.
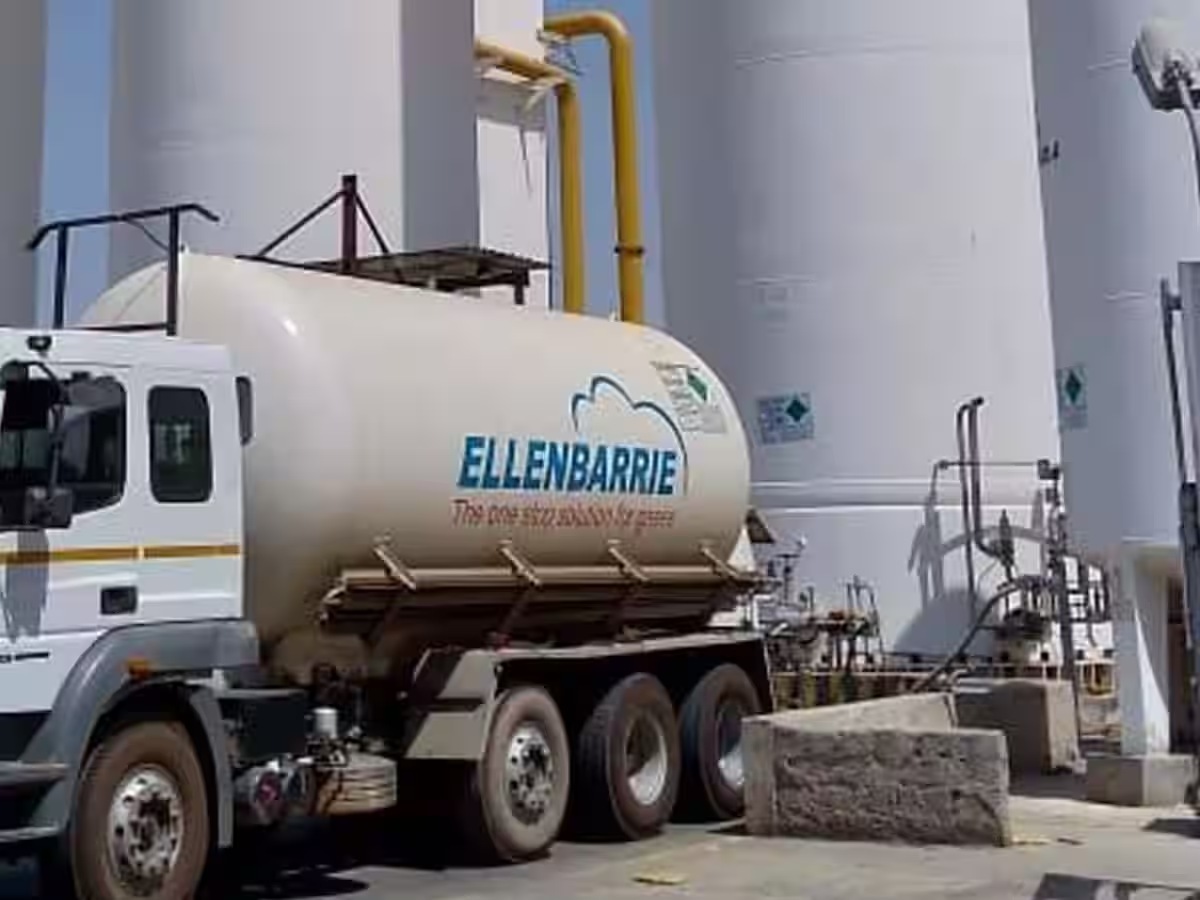
The business: manufacturing industrial gases (oxygen, nitrogen, argon, acetylene, hydrogen, CO₂, helium) in bulk, packaged, and onsite forms. Operations across West Bengal, Andhra Pradesh, and Telangana. Three revenue segments: bulk customers (75.5% of revenue), packaged sales (20%), and onsite installations (4.5%). Customers: steel plants, pharma, chemicals, hospitals, railways, defense, space agencies. Basically, anyone who needs gas to make something works.
The Management’s Concall Gem (Feb 3, 2026): When asked about Q3 margins collapsing, management said: “We don’t expect this to sustain. We do feel that the worst is over.” Translation: Q3 was an accident. Q4 will be better. Trust us. We’re fixing it. (Narrator voice: they know exactly what the problem is.)
03 — Business Model: WTF Do They Even Do?
They Make the Air You Breathe (And Sell It Back to You)
Industrial gases sound boring. “We make oxygen.” Yes, and Tata Steel doesn’t just make steel — they make the metal that builds bridges, cities, dreams, and also IPO dreams that evaporate in 6 months.
Ellenbarrie operates three business models simultaneously:
1. Onsite Air Separation Units (ASUs): Build a plant at the customer’s location (usually steel plants). Supply oxygen and nitrogen via pipeline. Customer pays a fixed lease + O&M charges monthly regardless of volume. Revenue is predictable. Margin profile is 40-45%. This is the “Raj Mahal” of business models — set it and forget it.
2. Bulk Merchant Sales: Produce gas at their facilities, load into cryogenic tankers, deliver to customers. Oxygen 48% of revenue, nitrogen 37%, argon 9%, acetylene 2%, hydrogen 1.5%. Margins compress when commodity prices (especially argon) fall. This is what went sideways in Q3.
3. Packaged Cylinder Sales: Fill cylinders with gas, distribute through dealers to end-users (hospitals, workshops, repair shops). Smaller margin per unit, but volume plays add up. 20% of revenue.
Installed capacity: 3,691 TPD (tonnes per day) across 8 facilities. Revenue drivers: onsite ASUs (predictable lease income), merchant sales (commodity-linked), and packaged (volume-linked). Customer concentration risk? 1,836 customers. 92% repeat customers. No single customer is more than probably 5-6% of revenue (not disclosed, but inferred from structure).
Fun fact from the concall: “We only recognize the fixed monthly amount” from onsite contracts. Translation: even when steel plants reduce liftoff, Ellenbarrie doesn’t care in its P&L. They still get their ₹X crore monthly check. Investors, however, noticed steel slowness and panicked. Stock down 61%.
04 — Financials Overview
Q3 FY26: The Numbers Did Not Go Brrr
Result type: Quarterly Results | Q3 FY26 EPS: ₹1.85 | 9M Avg EPS: (₹1.39+₹2.61+₹1.85)/3 = ₹1.95 | Annualised EPS: ₹7.80
| Metric (₹ Cr) |
Q3 FY26
Dec 2025 |
Q3 FY25
Dec 2024 |
Q2 FY26
Sep 2025 |
YoY % |
QoQ % |
| Revenue from Ops | 81.4 | 68.1 | 89.2 | +19.6% | -8.8% |
| EBITDA | 25.3 | 25.9 | 33.8 | -2.3% | -25.1% |
| EBITDA Margin % | 31% | 38% | 38% | -700 bps | -700 bps |
| PAT | 26.1 | 19.2 | 18.6 | +35.9% | +40.3% |
| EPS (₹) | 1.85 | 1.47 | 2.61 | +25.9% | -29.1% |
The Plot Twist: PAT was up 35.9% YoY, but EBITDA was down 2.3%. How? Tax rate. Q3 had a 24% tax rate vs Q2’s much lower rate. The profit number is a narrative trap. Real operational performance? Margins tanked 700 bps because argon prices crashed and steel is sleepy. And yet P/E is 27.97x. That’s Nifty50 expensive for a single-digit growth company in a commoditized industry.
💬 A 31% EBITDA margin in Q3 vs 38% in Q2 is a massive miss. Management says “temporary.” Do you believe them, or is this the new normal after the specialty gas push into renewables and semiconductors changes the margin profile? Comment your take.
05 — Valuation: Fair Value Range
Are We Paying ₹198 for a ₹150 Story?
Method 1: P/E Based
TTM EPS = ₹7.18. Sector median P/E (for industrial gases) = ~28.4x. For a company growing at mid-single digits with margin pressure, justified P/E should be 18x–24x.
→ 18x × ₹7.18 = ₹129.2 24x × ₹7.18 = ₹172.3
Range: ₹130 – ₹175
Method 2: Price to Book Value
Book Value = ₹65.4. Current P/BV = 3.03x. For industrial manufacturing with 17.8% ROE and ₹3,691 crore capex underway, a 2.0x–2.5x P/BV is more defensible. 3.03x assumes flawless execution on all growth projects.
→ 2.0x × ₹65.4 = ₹130.8 2.5x × ₹65.4 = ₹163.5
Range: ₹131 – ₹164
Method 3: EV/EBITDA (TTM Basis)
TTM EBITDA (9M FY26 run-rate) ≈ ₹114 crore. EV (using ₹2,790 market cap + ₹119 net debt, roughly ₹2,909 crore). EV/EBITDA = 25.5x. Industrial gas industry typical range: 16x–22x. Ellenbarrie at 25.5x is premium-priced. Fair EV/EBITDA for this growth/margin profile: 18x–22x.
18x × ₹114 = ₹2,052 crore (minus net debt) → per share: ₹143
22x × ₹114 = ₹2,508 crore (minus net debt) → per share: ₹180
Range: ₹143 – ₹180
Consolidated View: Fair value across methods: ₹130–₹175 range. Current price ₹198 sits above all three methods. IPO float is still locked in, retail euphoria is fading, and the ₹69% drawdown from peak is partly justified. However, if new capacity ramps smoothly and specialty gases/solar contracts materialize, upside to ₹200–₹220 is possible. Today’s ₹198 is essentially fairly valued to slightly overvalued unless Q4 & FY27 execution is pristine.
⚠️ EduInvesting Fair Value Range: ₹130 – ₹180. This fair value range is for educational purposes only and is not investment advice. Please consult a SEBI-registered investment advisor before making any financial decision.
06 — What’s Cooking: News, Triggers & Drama
New Plants, Specialty Gases, and the Solar Gold Rush