01 — At a Glance
The Office Desk Startup That Accidentally Became a Furniture Factory
- 52-Week High / Low₹374 / ₹191
- Q3 FY26 Revenue₹270 Cr (in ₹ million)
- Q3 FY26 PAT₹62.4 Cr (in ₹ million)
- TTM EPS₹16.73
- Book Value / Share₹45.3
- Operating Margin45.4%
- Promoter Holding60.4% (up 15% last quarter)
- ROCE21.4%
- ROE (3-yr avg)22.7%
- Debt / Equity1.77x
Flash Summary: EFC just posted Q3 revenue of ₹270 crore, up 52% YoY. PAT of ₹62.4 crore up 43% YoY. Three-year profit CAGR: 2,143% (yes, you read that right). The stock has crashed 40% in 6 months despite growing like a weed. Why? Because the market still thinks it’s an office-leasing company, not realizing it’s morphing into a diversified (slightly chaotic) office real estate ecosystem. Then they merged with Whitehills in November, absorbed another company in December, and the stock is still trading at 4.3x book value. Somewhere, a value investor is sweating nervously.
02 — Introduction
Three Businesses In a Trench Coat, Pretending To Be One
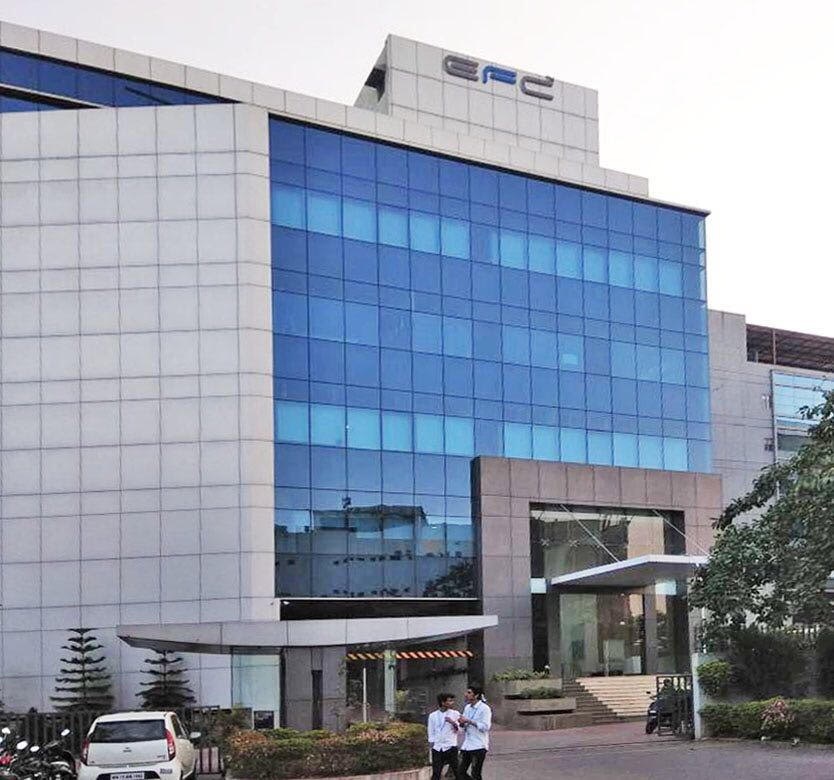
EFC (I) Ltd was incorporated in 1984 under the name Amani Trading and Exports. For most of its life, it was basically that quiet company your CA mentioned once but you never looked up. Then in 2021, someone figured out that India was desperately short of good office spaces for startups and small companies. EFC pivoted, rebranded, and went full “managed workspace” mode — think WeWork, but actually profitable and with actual offices instead of just Instagram aesthetics.
By 2024, they’d cracked the leasing business. Then they bought an interior design firm called Whitehills. Then they started manufacturing furniture. Then they bought a co-working space operator called Bigbox. By 2025, they’d merged with Whitehills formally and increased their stake in their furniture arm to nearly 90%. It’s like watching a guy start a tea shop, then realize he should make his own cups, then decide to own the pottery factory too.
Latest news: on December 26, 2025, they bumped Ek Design (furniture subsidiary) stake to 89.59% and took full ownership of their retail subsidiary. The company is now running 91 centers, 73,000+ seats under management across 11 cities, with a design & build order book of ₹160+ crore. Management says they’re aiming to add 20,000 seats annually. The stock is down 40% from its 52-week high despite literally printing money. Why? Because the market is still trying to figure out what the company actually does.
Management Insight (Feb 2026 Concall): “We are no longer operating as isolated verticals but as a well-aligned ecosystem where leasing, design and build, and furniture reinforce each other.” Translation: we’re trying to lock customers into a flywheel where they lease office space → need interior design → buy our furniture. Genius? Yes. Complicated to explain to investors? Also yes.
03 — Business Model: Three Things At Once
The Modern Indian Startup’s Fever Dream Becomes a Company
Let me break down the chaos called “three-vertical growth strategy.” EFC runs three separate profit centers, but management wants you to believe they’re actually one beautiful ecosystem. Let’s see if they’re right.
Vertical 1: Leasing (62% of revenue, the foundation) — They own or lease office spaces and sub-lease them to corporations and startups. Think of them as landlord-lite. They manage 91 centers spread across 11 cities with 73,000+ seats. Blended occupancy is around 90%+. Average enterprise client tenure is 48 months — that’s surprisingly sticky. Their addressable market: every company that doesn’t want to sign a 10-year lease with a traditional landlord. Why? Because enterprises want “capex-light” operations. Their pitch: “We’ll manage your office, you focus on your business.” It’s simple. It works.
Vertical 2: Design & Build / Interiors (33% of revenue, the growth accelerator) — Through Whitehills (now fully merged), they design and fit-out office spaces. Latest quarter: 76% YoY growth. Nine-month growth: 75% YoY. Order book: ₹160+ crore. They’ve designed 5.1 million square feet for 40+ clients including TCS. Management is guiding 50-60% YoY growth for the next 1-2 years. This is where the real margin expansion is happening. Why are they good at this? Because they also own the leasing business, so they understand customer needs. Also, they now buy their own furniture, which they sell back to customers — that’s the flywheel they’re talking about.
Vertical 3: Furniture Manufacturing (5% of revenue, the margin lever) — Ek Design Industries, incorporated Feb 2024. They’ve delivered 50,000+ units, have 1,200+ SKUs, and got multiple TUV certifications. Current utilization: 35-40%. Target: 75-80% by end of Q2 FY27. Why does utilization matter? Because once you hit 60%+, margins normalize. Management is guiding toward 25% pre-tax margins, ~20-22% post-tax. They’re currently sitting around 16 Cr quarterly sales (net profit of ₹16 Cr), but that’s with sub-optimal utilization. Once they hit 70%+ capacity, this could be a ₹30-40 Cr quarterly division.
Leasing Revenue~50%Q3 contribution
Design & Build~44%Q3 contribution
Furniture~6%Q3 contribution
Blended Occupancy90%+Leasing division
The genius move: corporate customers come for office space. EFC says “we also do interiors.” Customer says “sure, let’s save money.” Then comes the furniture pitch. By the time you’re done, EFC has captured your lease, your renovation budget, and your furniture spend. That’s vertical integration as a flywheel, and it actually works.
04 — Financials Overview
Q3 FY26: The Numbers That Make Spreadsheets Blush
Result type: Quarterly Results | Q3 FY26 EPS: ₹4.61 | Annualised EPS (Qtr Avg × 4): (₹5.57 + ₹3.46 + ₹4.61)/3 = ₹4.55 × 4 = ₹18.18
| Metric (₹ Million) |
Q3 FY26
Dec 2025 |
Q3 FY25
Dec 2024 |
Q2 FY26
Sep 2025 |
YoY % |
QoQ % |
| Revenue | 270 | 178 | 255 | +51.7% | +5.9% |
| Operating Profit | 112 | 93 | 111 | +20.4% | +0.9% |
| OPM % | 41% | 52% | 44% | -1,100 bps | -300 bps |
| PAT | 62.4 | 43.5 | 57 | +43.2% | +9.5% |
| EPS (₹) | 4.61 | 3.21 | 3.46 | +43.6% | +33.2% |
The OPM Story: Operating margin fell from 52% to 41% QoQ. Sounds bad. Actually means they’re adding more Design & Build and Furniture revenue (lower margin, higher volume) while the core Leasing margins stay ~30-32%. This is intentional. Management said “EBITDA less representative because of Ind AS; use EBIT or PAT instead.” Translation: don’t get hung up on the margin compression. The PAT grew 43%, which is what matters.
9-Month Bonanza: 9M FY26 revenue is ₹745 crore, up 67% YoY. 9M PAT is ₹166 crore, up 79% YoY. That’s already nearly double the FY25 full-year PAT (₹141 crore). Q4 is going to be spicy.
💬 With PAT growing 43% but margins compressing, are you worried about quality of earnings? Or does it make sense that they’re sacrificing margin for volume? What’s your take on the revenue mix shift?
05 — Valuation: Fair Value Range
Is ₹196 Cheap? Or Is The Market Just Confused?
Method 1: P/E Based Valuation
TTM EPS = ₹16.73. Current P/E = 14.6x. Industry median P/E for office/commercial services = 18.98x (per peer comparison). Given that EFC’s businesses are growing at 50-80% (Design & Build), but leverage is elevated (1.77x D/E), a justified P/E band is 12x-16x.
→ 12x × ₹16.73 = ₹200.76 16x × ₹16.73 = ₹267.68
Range: ₹200 – ₹270
Method 2: Price to Book Value
Book Value = ₹45.3. Current P/BV = 4.32x. For high-growth companies (>40% revenue CAGR), a 3x-5.5x P/BV is reasonable if ROE is >20% and debt is manageable. EFC has 23.3% ROE and 1.77x D/E (manageable for real estate). Fair P/BV band: 3.5x-5.5x.
→ 3.5x × ₹45.3 = ₹158.55 5.5x × ₹45.3 = ₹249.15
Range: ₹160 – ₹250
Method 3: EV/EBITDA (Adj. for Leverage)
TTM EBITDA ≈ ₹434 cr. Enterprise Value = ₹3,657 Cr. EV/EBITDA = 8.42x. Given growth trajectory (50-80% in Design & Build, utilization ramp in Furniture), a 7x-10x band is justified. Peer comparison shows median EV/EBITDA = 8.09x (we’re already there).
Equity value at 7x-10x EBITDA implies ₹175-₹245 range per share.
Range: ₹175 – ₹245
Consolidated View: All three methods converge around ₹175-₹270. CMP is ₹196 — essentially at the lower bound. This suggests either (a) the market is pricing in execution risk on the three-vertical strategy, (b) the Whitehills merger integration is uncertain, or (c) the market is waiting to see if furniture utilization actually ramps like management claims. Fair value appears to be in the ₹220-₹270 range, assuming execution on growth targets.
⚠️ EduInvesting Fair Value Range: ₹200 – ₹270. This fair value range is for educational purposes only and is not investment advice. Please consult a SEBI-registered investment advisor before making any financial decision.
06 — What’s Cooking: M&A, Mergers & Chaos Management
Three Acquisitions in Six Months (Send Coffee)