Duncan Engineering Ltd Q3 FY26: ₹19.6 Cr Revenue, 47% QoQ Profit Jump, But 31× P/E for a Pneumatics Veteran?
1. At a Glance – Smallcap, Big Valves, Bigger Questions
₹155 Cr market cap. ₹420 stock price. Down 13% in 3 months and ~23% in 6 months, while the company just reported a 47% QoQ jump in quarterly profit. Classic Indian smallcap behaviour: good numbers, bad mood.
Duncan Engineering Ltd (DEL) is one of those companies your uncle from Pune’s MIDC circle respects deeply, but your WhatsApp stock group barely remembers. Pneumatics, automation, tyre valves, actuators—this is hardcore industrial plumbing, not flashy EV or AI nonsense.
Latest quarter (Dec 2025) shows ₹19.6 Cr sales, ₹1.03 Cr PAT, and EPS of ₹2.79. Annualise that (don’t worry, we’ll do it properly) and the stock trades at ~31× earnings, which is… ambitious for a company growing sales at single digits and margins that behave like Mumbai weather.
Debt is low. Promoters hold 74.6%. Dividend yield exists (yes, miracle). But ROE is under 10%, and operating margins have quietly slid from mid-teens to high single digits.
So is this a sleepy industrial compounder being ignored? Or a well-run but fully-priced valve seller living off nostalgia and other income?
Before you decide, ask yourself: how exciting can air cylinders really get?
2. Introduction – The Old School Engineer in a World of Instagram Stocks
Duncan Engineering was incorporated in 1962. That’s before most listed startups today were even a PowerPoint fantasy. This company has survived licence raj, liberalisation, globalisation, and multiple management reshuffles—so clearly it knows how to stay alive.
DEL operates in industrial pneumatics, valve automation systems, and off-highway tyre valves. Not consumer-facing, not brand-driven, and definitely not trending on Twitter. Its customers don’t care about ads; they care whether the actuator works at 3 AM in a refinery.
Ownership-wise, this is a proper Indian industrial JV story—promoted by Schrader Bridgeport International (Tomkins group) and the Duncan Group (JP Goenka family of Oriental Carbon & Chemicals). That lineage brings credibility, but also the classic “steady, conservative, no drama” management style.
The business is overwhelmingly domestic (~98% India), with exports being more of a side hustle than a strategy. Growth isn’t explosive, but neither is the balance sheet reckless.
However, the stock market is not a museum. Survival alone doesn’t earn premium valuations. The real question is: does Duncan Engineering deserve a 30+ P/E when its growth and returns are… polite?
Let’s open the hood.
3. Business Model – WTF Do They Even Do?
Imagine a factory without air. Not oxygen—compressed air. No movement, no automation, no control systems. That’s Duncan Engineering’s playground.
What DEL actually sells:
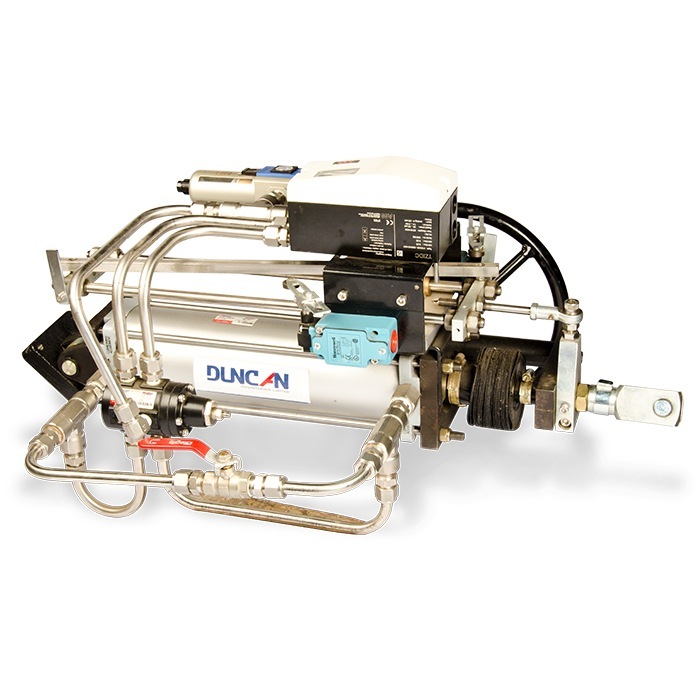
Fluid Power & Automation Products Pneumatic cylinders, valves, air prep units, tubing, fittings—basically the muscles and nerves of industrial automation.
Valve Automation Systems Rotary actuators (4Nm to 4000Nm torque), solenoids, limit switches, NAMUR valves—used in oil & gas, chemicals, power plants.
OTR Tyre Valves & Accessories Off-highway vehicles, heavy machinery, industrial tyres—boring but essential.
Customised Solutions Control panels, positioner cylinders—higher margin, lower volume, more brainpower.
Manufacturing happens at Ranjangaon, Pune, which is basically an industrial pilgrimage site. The company is ISO 9001 certified, meaning processes exist, not jugaad.
This is a B2B, order-driven, replacement-demand-heavy business. Growth depends on capex cycles, infra spending, refinery upgrades, and industrial automation adoption.
Here’s the catch:
No brand moat like consumer goods
Limited export leverage
Pricing power exists, but only so much
So the business is solid, but not sexy. Which makes valuation discipline extremely important.
4. Financials Overview – Numbers Don’t Lie, But They Do Yawn
Quarterly Performance Table (₹ Cr, Standalone)
Metric
Latest Qtr (Dec 25)
YoY Qtr (Dec 24)
Prev Qtr (Sep 25)
YoY %
QoQ %
Revenue
19.62
19.98
18.22
-1.8%
+7.7%
EBITDA
1.59
1.13
1.75
+40.7%
-9.1%
PAT
1.03
0.70
1.41
+47.1%
-27.0%
EPS (₹)
2.79
1.89
3.81
+47.6%
-26.8%
Annualised EPS (Q3 logic): Average of Q1, Q2, Q3 FY26 EPS = (3.35 + 3.81 + 2.79) /