1. At a Glance
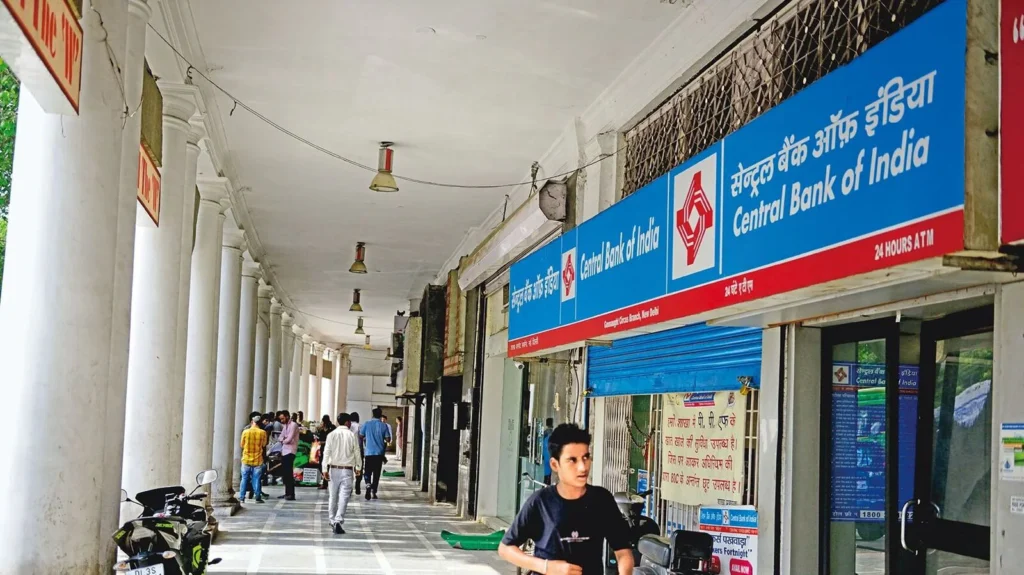
Central Bank of India, once the poster boy of NPAs, now flirts with profitability. With EPS growing 5x in 3 years, a foray into insurance, and gross NPAs finally (finally!) below 3.2%, the old-timer PSU is showing signs of life. But is it too little, too late?
2. Introduction with Hook
If public sector banks were Bollywood characters, Central Bank was the tragic sidekick—always in trouble, always ignored.
Now?
It’s gone from “Please merge me” to “Please rate me.”
- EPS up from ₹1.24 (FY22) to ₹4.81 (FY25)
- Net NPA down to 0.50%
- Entered insurance via stake in Future Generali
After years in PCA purgatory, CBI’s breakout might just be the sleeper hit of PSU banking.
3. Business Model (WTF Do They Even Do?)
They’re a classic PSU bank — but here’s how the income flows:
- Retail & Corporate Banking (Core bread & butter)
- Treasury Operations (Govt. securities, forex, bonds)
- Insurance Collab – Recent 25% stake in both FGIICL (General) & FGILICL (Life)
The bank is trying to shift gears from lending to also distributing — pushing more third-party products, and even tying up for co-lending with fintechs.
4. Financials Overview
| Year | Revenue ₹ Cr | Net Profit ₹ Cr | EPS ₹ | NIM % | GNPA % | NNPA % |
|---|---|---|---|---|---|---|
| FY22 | 22,903 | 1,083 | 1.24 | 2.47 | 14.84 | 3.93 |
| FY24 | 30,849 | 2,677 | 3.07 | 3.12 | 3.87 | 0.61 |
| FY25 | 33,797 | 3,943 | 4.35 | 3.21 | 3.18 | 0.56 |
| TTM | 34,054 | 4,283 | 4.81 | 3.21 | 3.14 | 0.50 |
Glow-Up Highlights:
- 🟢 Asset quality turned from horror show to highlight reel
- 🟢 EPS compounding at 55% over 3 years
- 🔴 But revenue growth still a modest 7% CAGR over 5 years
5. Valuation
a) P/E Based
- EPS (TTM): ₹4.81
- Sector P/E median: ~7.5x
- Fair Value Range = ₹36–₹48
- CMP: ₹38 → Mid-range, with room IF loan book grows
b) Price to Book
- Book Value: ₹40.8
- CMP/BV = 0.94x → Below book = Value Unlock Theme?
c) Dividend Yield
- FY25 payout = ₹0.49% → Meh, but positive sign
Conclusion:
Valuation still pricing in PSU discount. But fundamentals say “we’re not dead yet.”
6. What’s Cooking – News, Triggers, Drama
Trigger Buffet:
- ₹5,000 Cr QIP approved at AGM
- Acquired 25% in Future Generali India Life & General Insurance
- Co-lending pact with Vastu Housing
- Rating upgrades by ICRA & CRISIL
- Gross Advances & Deposits Crossed ₹7 Lakh Crore
Narrative Shift:
- From NPA ka gaddha → To insurance-backed PSU ninja
- Fintech + Insurance bets might de-risk future P&L
7. Balance Sheet
| Year | Equity | Reserves | Deposits | Borrowings | Total Assets |
|---|---|---|---|---|---|
| FY20 | ₹5,710 Cr | ₹15,827 Cr | ₹3.14 Lakh Cr | ₹6,076 Cr | ₹3.57 Lakh Cr |
| FY23 | ₹8,681 Cr | ₹20,536 Cr | ₹3.60 Lakh Cr | ₹8,334 Cr | ₹4.07 Lakh Cr |
| FY25 | ₹9,051 Cr | ₹27,830 Cr | ₹4.13 Lakh Cr | ₹21,820 Cr | ₹4.80 Lakh Cr |
Key Notes:
- 👊 Equity capital has doubled post recap
- 🟢 Reserves building back
- 🟠 Borrowings surged in FY25 — funding expansion?
8. Cash Flow – Sab Number Game Hai
| Year | CFO ₹ Cr | CFI ₹ Cr | CFF ₹ Cr | Net Flow |
|---|---|---|---|---|
| FY22 | +14,277 | -133 | 0 | +14,143 |
| FY24 | -5,910 | -584 | 0 | -6,494 |
| FY25 | -2,460 | -451 | +1,500 | -1,410 |
Interpretation:
- Negative CFO in FY24-25 → Aggressive provisioning or lending spike?
- Investing in insurance = cash guzzler short-term, but maybe clever long-term?
9. Ratios – Sexy or Stressy?
| Metric | FY23 | FY24 | FY25 |
|---|---|---|---|
| Net Interest Margin | 3.02% | 3.12% | 3.21% |
| ROE | 6.0% | 9.0% | 11.4% |
| CASA Ratio | 49.8% | 50.2% | 50.6% |
| Gross NPA | 8.4% | 3.18% | 3.14% |
| Net NPA | 1.8% | 0.56% | 0.50% |
Verdict:
ROE/NIM inching up → Big turnaround.
CASA still strong. GNPA almost halved in 2 years.
10. P&L Breakdown – Show Me the Money
| Year | Interest Earned | Other Income | Total Income | PAT | EPS |
|---|---|---|---|---|---|
| FY23 | ₹13,905 Cr | ₹4,164 Cr | ₹25,657 Cr | ₹1,688 Cr | ₹1.93 |
| FY24 | ₹17,882 Cr | ₹4,814 Cr | ₹30,849 Cr | ₹2,677 Cr | ₹3.07 |
| FY25 | ₹19,830 Cr | ₹5,996 Cr | ₹33,797 Cr | ₹3,943 Cr | ₹4.35 |
Narrative:
- Other income still a massive chunk → underwriting risk
- EPS = MoM growth for 9 quarters straight
11. Peer Comparison
| Bank | CMP ₹ | ROE % | GNPA % | Net NPA % | CASA % | P/BV | P/E |
|---|---|---|---|---|---|---|---|
| SBI | 823 | 17.2 | 2.4 | 0.60 | 42% | 1.51 | 9.47 |
| Canara Bank | 114 | 17.8 | 4.4 | 0.7 | 33% | 0.98 | 5.9 |
| Bank of Baroda | 244 | 15.5 | 3.9 | 0.6 | 39% | 0.86 | 6.1 |
| Central Bank | 38 | 11.4 | 3.1 | 0.5 | 50.6% | 0.94 | 8.2 |
Takeaway:
Valuation is cheap, NPA cleanup done.
But ROE still lags big brothers.
12. Miscellaneous – Shareholding, Promoters
| Stakeholder | Sep ’23 | Jun ’25 |
|---|---|---|
| Promoter (GoI) | 93.08% | 89.27% |
| FIIs | 0.07% | 0.96% |
| DIIs | 2.79% | 5.07% |
| Public | 4.04% | 4.70% |
Key Trends:
- FII + DII interest rising
- Promoter stake diluted slightly (likely due to QIP)
- Retail base growing steadily
13. EduInvesting Verdict™
Central Bank of India has gone from “death watch” to “value watch.”
It’s still not HDFC Bank, but it’s no longer the last man picked in PSU dodgeball.
- EPS growth? Solid.
- NPA cleanup? Legit.
- Insurance bets? Smart.
- Dividend? Small, but it exists.
What it needs:
- Loan book acceleration
- More DII/FII trust
- Retail product innovation
Watchlist material? Yes.
Rocketship? Not yet.
Metadata
– Written by EduInvesting Research | 20 July 2025
– Tags: Central Bank of India, PSU Bank, NPA Cleanup, Insurance, Turnaround, Value Investing


