1. At a Glance – Blink and You’ll Miss the Margins
Birla Corporation Ltd (BCL), the slightly underrated cement cousin in the MP Birla Group family, currently sits at a market cap of ₹8,131 crore with a stock price of ₹1,056. Over the last three months, the stock has corrected ~10%, and six months look even uglier at ~19% down — clearly not a momentum darling.
But look closer: Q3 FY26 delivered revenue of ₹2,159 crore, EBITDA of ~₹293 crore, and PAT of ₹52.8 crore (up 71% YoY, thanks partly to a low base and margin recovery). EV/EBITDA is ~7x, P/B ~1.14x, and dividend yield is a respectable ~1%.
This is not a flashy cement stock. This is a “wait-kar-le-beta” cement stock. Question is — does patience still pay here?
2. Introduction – Cement Hai, Rocket Science Nahi
Birla Corporation has been making cement for decades — long before Twitter discovered EBITDA margins. Part of the MP Birla Group, the company operates in an industry where demand is cyclical, pricing power is regional, and costs are hostage to coal, petcoke, and logistics.
For years, BCL struggled with expansion pains, debt from acquisitions, and mediocre ROE. FY20–FY23 was basically a gym phase: heavy lifting, no mirror selfies. FY24 onwards, things are slowly starting to look… acceptable.
But acceptable is not excellence. And in cement, excellence is what UltraTech eats for breakfast.
So where does Birla Corp stand today — steady compounder or eternal turnaround story?
3. Business Model
– WTF Do They Even Do?
Let’s simplify it for your lazy investor brain:
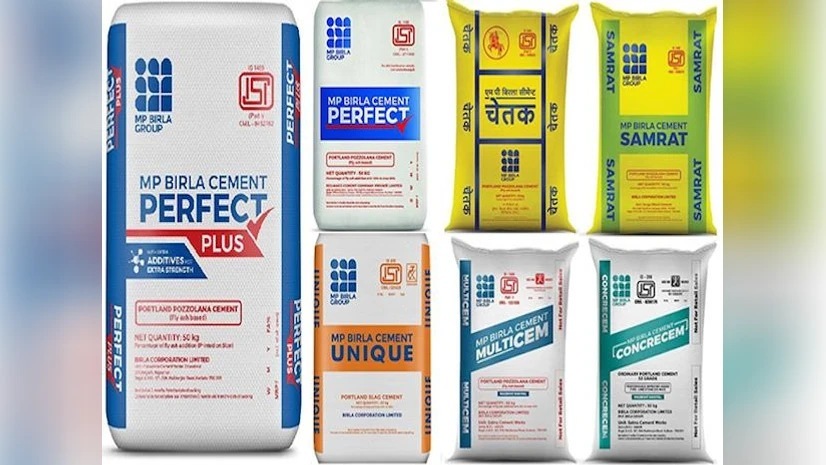
- 95% Cement: OPC, PPC, PSC — sold under brands like Chetak, Samrat, Ultimate, Perfect Plus.
- 5% Jute: Old-school jute goods business. Stable, boring, emotionally attached legacy asset.
Cement sales are split into:
- Popular cement (mass market),
- Premium cement (51% of FY23 trade sales — this is important),
- Institutional cement (bulk buyers).
They also sell wall putty and construction chemicals — not game changers, but decent add-ons.
In short: Dig limestone → burn money → grind clinker → sell cement → repeat.
4. Financials Overview – Numbers Don’t Lie, They Just Yawn
Quarterly Comparison (₹ Crore)
| Metric | Latest Qtr (Q3 FY26) | YoY Qtr | Prev Qtr | YoY % | QoQ % |
|---|---|---|---|---|---|
| Revenue | 2,159 | 2,257 | 2,207 | -4.3% | -2.2% |
| EBITDA | 293 | 248 | 305 | 18% | -4% |
| PAT | 52.8 | 31 | 90 | 71% | -41% |
| EPS (₹) | 6.85 | 4.05 | 11.75 | 69% | -42% |
Annualised EPS:
Average of Q1–Q3 FY26 EPS = (15.53 + 11.75 + 6.85) / 3 × 4 ≈ ₹45.4
Current P/E on annualised basis ≈ 23x — suddenly not that cheap, huh?
5. Valuation Discussion – Fair, Not
