1. At a Glance
One of India’s top 15 agrochemical companies, Best Agrolife boasts a product bouquet of 490+ formulations. While revenue grew from ₹127 Cr in FY17 to ₹1,814 Cr in FY25, profits are now vanishing faster than monsoon forecasts.
2. Introduction with Hook
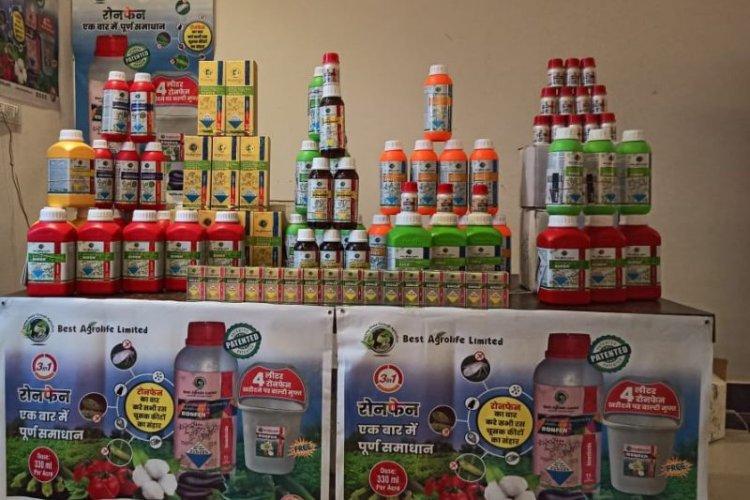
If Best Agrolife were a crop, it would be GM-engineered for hype. In FY23, it reaped ₹192 Cr PAT. Two years later, it’s down to ₹70 Cr. From high-yield seeds like Ronfen and Tricolor to murky management exits and SEBI KYC updates, this field’s got everything.
- FY25 Revenue: ₹1,814 Cr
- FY25 PAT: ₹70 Cr (down 63% in 2 years)
- ROE crashed from 21% → 10%
Time to harvest the facts.
3. Business Model (WTF Do They Even Do?)
Best Agrolife makes:
- Technical-grade agrochemicals
- Formulations like insecticides, herbicides, fungicides
- Public health products (we’re still checking what those are…)
Customers? Large domestic agro firms & MNCs via a P2P model.
Basically, they’re the backend supplier making your rice fields pest-free (sometimes your balance sheet too).
4. Financials Overview
| FY | Revenue | OPM % | PAT | ROE % | ROCE % |
|---|---|---|---|---|---|
| FY22 | ₹1,211 Cr | 14% | ₹105 Cr | — | 41% |
| FY23 | ₹1,746 Cr | 18% | ₹192 Cr | 21% | 34% |
| FY25 | ₹1,814 Cr | 11% | ₹70 Cr | 10% | 13% |
Flashpoint:
- Revenue peaked, profits fell
- ROCE cut by two-thirds in 2 years
- Working capital pain creeping up
5. Valuation
At CMP ₹426 with P/E of 14.4, it’s way below peers like PI (P/E 38), Bayer (P/E 50), and Sumitomo (P/E 59). But with fundamentals weakening…
| Valuation Method | Fair Value Range |
|---|---|
| P/E 15x (stable but cautious) | ₹440–₹460 |
| Industry Median (P/E ~38) | ₹900–₹1,000 (unrealistic now) |
| EV/EBITDA Adjusted | ₹400–₹500 |
| Post-dilution Risk Adjusted | ₹350–₹450 |
EduFair Value Band™: ₹350 to ₹460
(Unless it stops spraying EPS into the ground)
6. What’s Cooking – News, Triggers, Drama
- Director resignations, board reconstitution (July 2025)
- YoY PAT in red since FY23
- Working capital days remain sky-high
- KYC drive for shareholders + IEPF alerts
- EPS fell from ₹81.3 (FY23) → ₹29.6 (FY25)
- Price down 30% YoY—investors feeling pesticide burn
7. Balance Sheet
| FY | Equity | Reserves | Debt | Total Liabilities |
|---|---|---|---|---|
| FY22 | ₹24 Cr | ₹306 Cr | ₹270 Cr | ₹984 Cr |
| FY23 | ₹24 Cr | ₹504 Cr | ₹568 Cr | ₹1,475 Cr |
| FY25 | ₹24 Cr | ₹734 Cr | ₹478 Cr | ₹1,950 Cr |
Highlights:
- Borrowings up nearly 2x since FY22
- No equity dilution in 3 years
- Fixed assets nearly doubled, but returns halved
8. Cash Flow – Sab Number Game Hai
| FY | CFO | CFI | CFF | Net Cash |
|---|---|---|---|---|
| FY23 | ₹-180 Cr | ₹-19 Cr | ₹+248 Cr | ₹+49 Cr |
| FY24 | ₹+36 Cr | ₹-63 Cr | ₹-1 Cr | ₹-29 Cr |
| FY25 | ₹+228 Cr | ₹-29 Cr | ₹-199 Cr | ₹-0 Cr |
Translation:
Cash from ops is back, but investing and financing flows signal a cautious capex cycle.
9. Ratios – Sexy or Stressy?
| Metric | FY23 | FY24 | FY25 |
|---|---|---|---|
| ROCE | 34% | 16% | 13% |
| ROE | 21% | — | 10% |
| Debtor Days | 73 | 91 | 113 |
| Inventory Days | 391 | 864 | 220 |
| Cash Conv. Cycle | 297 | 434 | 179 |
Conclusion:
Inventory improved but debtors got worse. Still no just-in-time; more like just-in-June-payments.
10. P&L Breakdown – Show Me the Money
| FY | Revenue | OPM % | PAT | EPS |
|---|---|---|---|---|
| FY23 | ₹1,746 Cr | 18% | ₹192 Cr | ₹81.27 |
| FY24 | ₹1,873 Cr | 12% | ₹106 Cr | ₹44.94 |
| FY25 | ₹1,814 Cr | 11% | ₹70 Cr | ₹29.56 |
EPS Crashed: From ₹81 → ₹29.
And no, this isn’t a bonus-adjusted joke.
11. Peer Comparison
| Company | CMP | P/E | ROCE | Sales (₹Cr) | PAT (₹Cr) |
|---|---|---|---|---|---|
| PI Ind | ₹4,135 | 37.8 | 22.6% | ₹7,978 | ₹1,660 |
| Bayer | ₹6,354 | 50.3 | 24.7% | ₹5,473 | ₹568 |
| Sharda | ₹799 | 24.1 | 16.5% | ₹4,319 | ₹299 |
| Best Agro | ₹426 | 14.4 | 12.9% | ₹1,814 | ₹70 |
Verdict:
Cheap, but for a reason. Performance declining while peers are consolidating.
12. Miscellaneous – Shareholding, Promoters
| Quarter | Promoters | FIIs | DIIs | Public |
|---|---|---|---|---|
| Jun ‘22 | 47.3% | 10.8% | 0.2% | 41.7% |
| Mar ‘25 | 50.4% | 5.8% | 2.7% | 41.0% |
Red Flags:
- FIIs are bailing → 10.8% → 5.8%
- Public holding flat, despite price drop
- Number of shareholders ~37,500 = huge retail exposure
13. EduInvesting Verdict™
Best Agrolife was once the golden harvest of agro-chemicals. But FY25 looks like a patch of wilted crops. With revenues stagnant, margins thinning, and cash flow drama unfolding every other quarter, it’s no longer “Best”—just “Trying.”
Cheap valuation and strong base of formulations are tailwinds. But declining EPS, falling RoCE, and board churn scream caution.
Fair Value Range: ₹350–₹460
Beyond this, you’re farming dreams, not reality.
Metadata
– Written by EduInvesting Research Team | 18 July 2025
– Tags: Best Agrolife Ltd, Agrochemical Stocks, Crop Protection, India Pesticide Sector, FMCG Chemicals, ROE Crash, EPS Decline, FII Exit, EduSatire


