1. At a Glance
ATV Projects Ltd isn’t exactly the Tesla of capital goods — more like a legacy metalworker from the 80s, reincarnated into the EPC world with bagasse boilers and spherical tanks. With a ₹232 Cr market cap and recent buzz around land monetization and warrant issues, investors are suddenly perking up.
2. Introduction with Hook
Imagine an uncle from the 1980s suddenly getting a fashion makeover and trending on Instagram. That’s ATV Projects for you.
- Stock has delivered 74% CAGR over 3 years
- FY25 profit growth: 30% YoY, with 12.21% OPM
- Land asset monetization + preferential warrants = serious eyebrows raised
Legacy DNA + new-found financial discipline = potential dark horse?
3. Business Model (WTF Do They Even Do?)
ATV Projects is in the capital goods space, offering:
- Project Engineering & Management Services
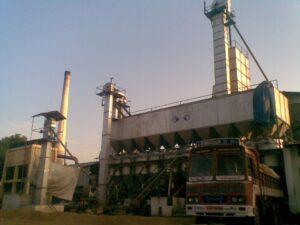
- Manufacturing of process equipment: energy-efficient mills, bagasse-fired boilers, LPG storage tanks, pressure vessels, heat exchangers
- Industries Served: Sugar, Petrochemicals, Fertilizer, Power, Chemical
Not a glamorous SaaS firm, but it builds the skeleton of India’s heavy industries. And yes, sugar mills still need boilers.
4. Financials Overview
Let’s break down the 10-year glow-up (or rather, slow grind):
| Year | Sales (₹ Cr) | Net Profit (₹ Cr) | OPM % | ROCE % | ROE % |
|---|---|---|---|---|---|
| FY14 | 56.0 | 1.7 | 3.2% | 0.7% | – |
| FY20 | 37.7 | 2.4 | 9.7% | 1.1% | 1.6% |
| FY23 | 47.8 | 5.1 | 10.2% | 1.5% | 3.7% |
| FY25 | 70.6 | 7.4 | 10.9% | 2.96% | 3.66% |
| TTM | 66.0 | 7.8 | 12.2% | – | – |
Narrative:
- Low-debt transformation (borrowings down from ₹487 Cr in FY14 to ₹43 Cr in FY25)
- Turnaround visible post FY20, thanks to cost control, higher efficiency, and land monetization.
5. Valuation
a) P/E Valuation:
- EPS (TTM): ₹1.46
- Sector P/E median: ~38
- FV Range = ₹28 to ₹55
- Current Price: ₹43.75 → near upper band
b) Book Value:
- BVPS: ₹38.8
- CMP/BV = 1.13x (fair)
c) EV/EBITDA Check:
- Operating Profit (TTM): ₹8 Cr
- EV ~₹275 Cr (incl. debt)
- EV/EBITDA ~34.4x → Slightly frothy
Verdict: Priced for a turnaround, not yet a value stock. FV range implies upside only if land sales/warrant capital delivers.
6. What’s Cooking – News, Triggers, Drama
- Jul ’25: Preferential issue of 2.5M warrants @ ₹41.50 = ₹10.37 Cr
- AGM Trigger: Land development revised from 2.71 to 3.29 acres
- No debt explosion, clean balance sheet
- Margins improving, Q1 FY26 OPM at 14.55%
- Buzzword Alert: “Self-development of land” = hidden RE asset?
Stock Price Trigger Possibilities:
- Land monetization surprise
- Order wins in EPC or chemicals
- Warrant conversion with promoter rejig
7. Balance Sheet
| FY Ended Mar | Equity | Reserves | Borrowings | Total Liabilities | Net Fixed Assets |
|---|---|---|---|---|---|
| FY14 | 52.6 | -290.2 | 487.4 | 271.1 | 224.6 |
| FY20 | 52.6 | 129.5 | 62.2 | 259.6 | 221.4 |
| FY25 | 52.6 | 153.4 | 42.7 | 259.3 | 213.5 |
Key Points:
- Book cleanup post-2016
- Net worth turning positive after a decade
- No major CAPEX = cash conservation mode
8. Cash Flow – Sab Number Game Hai
| Year | CFO (₹ Cr) | CFI | CFF | Net Flow |
|---|---|---|---|---|
| FY21 | -4.8 | +3.7 | -0.1 | -1.2 |
| FY23 | -0.9 | +1.4 | +0.2 | +0.6 |
| FY25 | +5.8 | +0.3 | -7.9 | -1.8 |
Highlights:
- FY25: Positive cash ops, but heavy outflow due to debt repayment
- Minimal investments, just enough to survive
- Not cash-rich, but not dying either
9. Ratios – Sexy or Stressy?
| Ratio | FY23 | FY24 | FY25 |
|---|---|---|---|
| ROCE | 1.5% | 2.6% | 2.96% |
| ROE | 3.7% | 4.0% | 3.66% |
| Debtor Days | 47.3 | 42.5 | 68.2 |
| Inventory Days | 433 | 334 | 166 |
| CCC (Cash Cycle) | 433 | 360 | 198 |
Narrative:
- ROE/ROCE crawling up, finally above 3%
- Working capital improved drastically — inventory days halved
- Debtor days spiked in FY25 → needs monitoring
10. P&L Breakdown – Show Me the Money
| Year | Revenue | EBITDA | PAT | EPS |
|---|---|---|---|---|
| FY23 | ₹47.8 Cr | ₹4.9 Cr | ₹5.1 Cr | ₹0.96 |
| FY24 | ₹61.5 Cr | ₹7.5 Cr | ₹6.5 Cr | ₹1.22 |
| FY25 | ₹70.6 Cr | ₹7.7 Cr | ₹7.4 Cr | ₹1.39 |
Margins:
- OPM = 12.21%
- PAT Margin = ~10.5%
Turnaround Tale: Steady sales growth + controlled expenses = margin jump.
11. Peer Comparison
| Company | CMP (₹) | MCap (Cr) | ROCE % | OPM % | P/E | PAT Qtr (₹Cr) |
|---|---|---|---|---|---|---|
| Kaynes Tech | 5853 | 39190 | 14.4 | 15.1 | 133 | 116.2 |
| Honeywell Auto | 40470 | 35775 | 18.4 | 14.1 | 68 | 139.9 |
| LMW | 16175 | 17280 | 4.5 | 4.6 | 166 | 11.5 |
| ATV Projects | 43.8 | 232 | 3.0 | 12.2 | 29.8 | 2.0 |
Conclusion:
ATV is the tiny elephant in the room. Undervalued vs peers but lacks the growth pedigree — yet.
12. Miscellaneous – Shareholding, Promoters
| Type | Mar ‘25 |
|---|---|
| Promoters | 26.95% |
| DIIs | 2.34% |
| Public | 70.71% |
- High retail holding = volatility
- No FII interest yet = no institutional confidence
- But promoter infusing capital via warrants = potential positive
13. EduInvesting Verdict™
ATV Projects is one of those old economy stories that could quietly 2x… or stay a penny stock forever. It’s gone from accounting ashes to a margin-positive zombie on a cleanup mission. If they pull off land monetization + scale order wins, then the ₹43 price tag could look like a joke in hindsight.
But for now, it’s a speculative engineering play with:
- A tiny balance sheet,
- improving ratios,
- some hidden real estate sizzle.
One to track, not one to nap.
Metadata
– Written by EduInvesting Analyst Team | July 20, 2025
– Tags: Capital Goods, Turnaround, Smallcap, ATV Projects, Engineering, Land Monetization, Warrants


