1. At a Glance
GSM Foils Ltd just dropped a 173% YoY profit growth bomb in Q1 FY26. A smallcap packaging player riding pharma demand and aluminium tailwinds is now a 45%+ ROE, high-OPM machine. But is it too hot to handle or just heating up?
2. Introduction with Hook
Imagine wrapping your multibagger dreams in a shiny sheet of aluminium. That’s GSM Foils – a company so fresh it was incorporated in 2019 and now flaunts ROE of 46%, blistering margins, and a 337% 1-year price run.
- Q1 FY26 Sales: ₹52 Cr (YoY: +147%)
- Q1 FY26 PAT: ₹3.83 Cr (YoY: +173%)
From ₹41 to ₹190 – this isn’t a stock chart, it’s a SpaceX launch graph.
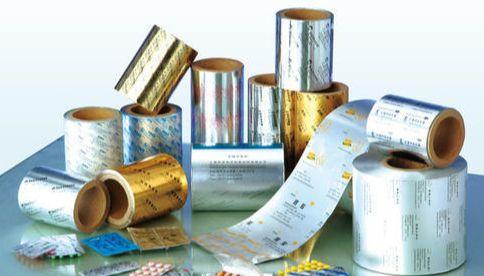
3. Business Model (WTF Do They Even Do?)
GSM Foils manufactures aluminium-based pharma packaging – specifically:
- Blister Foils: Commonly used to seal capsules and tablets
- Strip Pharma Foils: Same job, different look
- Foils range from 0.020 to 0.040 microns
Clients = Pharma companies. Product = high barrier, tamper-proof, FDA-loved stuff. Think of it as Zomato for pills – ensures they reach you clean and safe.
4. Financials Overview
Quarterly Trends (₹ Cr)
Quarter | Sales | PAT | OPM % | EPS (₹) |
---|---|---|---|---|
Jun-24 | 21.0 | 1.40 | 10.2% | 1.09 |
Sep-24 | 31.2 | 2.12 | 10.3% | 1.65 |
Dec-24 | 36.0 | 2.72 | 11.2% | 2.12 |
Mar-25 | 45.6 | 3.42 | 12.7% | 2.67 |
Jun-25 | 52.0 | 3.83 | 11.2% | 2.99 |
Trailing 12 Months:
- Revenue: ₹165 Cr
- PAT: ₹12 Cr
- OPM: 11.4%
- ROCE: 45.6%
- ROE: 45.7%
Note: These numbers aren’t “improving”; they’re compounding like bacteria in a petri dish. Fast.
5. Valuation
Current Price: ₹190
EPS (TTM): ₹9.43
P/E: 20.1
Book Value: ₹24.4 → Price/Book: 7.79
Fair Value Range:
- DCF (moderate assumptions): ₹150 – ₹180
- PE-based (20x trailing): ₹180 – ₹200
- Bull case (25x forward): ₹220
Conclusion: Priced to perfection? Maybe. Overpriced? Debatable. Hot? Definitely.
6. What-If Scenarios
Scenario | Revenue FY26 | PAT FY26 | Implied Price (20x PE) |
---|---|---|---|
Base Case | ₹200 Cr | ₹15 Cr | ₹225 |
Bullish Pharma | ₹220 Cr | ₹18 Cr | ₹270 |
Aluminium Volatility | ₹180 Cr | ₹12 Cr | ₹180 |
Trigger Warning: Any derailment in pharma sector demand or aluminium input prices = pressure on margins.
7. What’s Cooking – News, Triggers, Drama
- Q1 FY26 results blew past expectations
- Investor Presentation released with bullish commentary
- No debt issues. Expansion funded by internal accruals + modest financing
- Still no dividend. Management clearly thinks compounding > sharing
Coming Up:
- Capacity expansion hints in concalls
- Potential tie-ups with export-oriented pharma players
8. Balance Sheet
Metric | Mar 2023 | Mar 2024 | Mar 2025 |
---|---|---|---|
Equity Capital | ₹0.02 Cr | ₹9 Cr | ₹13 Cr |
Reserves | ₹1 Cr | ₹2 Cr | ₹18 Cr |
Borrowings | ₹14 Cr | ₹5 Cr | ₹18 Cr |
Total Liabilities | ₹22 Cr | ₹20 Cr | ₹61 Cr |
Fixed Assets | ₹1 Cr | ₹1 Cr | ₹2 Cr |
Investments | ₹0 Cr | ₹0 Cr | ₹3 Cr |
Other Assets | ₹21 Cr | ₹19 Cr | ₹56 Cr |
Key Takeaway: Leverage up, but backed by strong asset growth. Balance sheet expanding with top-line.
9. Cash Flow – Sab Number Game Hai
Type | Mar 2023 | Mar 2024 | Mar 2025 |
---|---|---|---|
Operating Cash | ₹-2 Cr | ₹-14 Cr | ₹-18 Cr |
Investing Cash | ₹0 Cr | ₹-1 Cr | ₹-5 Cr |
Financing Cash | ₹3 Cr | ₹15 Cr | ₹22 Cr |
Net Cash Flow | ₹0 Cr | ₹0 Cr | ₹-0 Cr |
Interpretation: High growth = working capital pressure. Negative operating cash flow is a red flag for sustainability unless fixed soon.
10. Ratios – Sexy or Stressy?
Metric | Mar 2023 | Mar 2024 | Mar 2025 |
---|---|---|---|
ROCE | — | — | 45.6% |
ROE | — | — | 45.7% |
Debtor Days | 94 | 65 | 92 |
Inventory Days | 188 | 113 | 62 |
CCC (days) | 190 | 149 | 130 |
EPS | ₹1.46 | ₹7.53 | ₹9.43 |
Judgment: ROCE/ROE = elite. CCC improvement = good ops mgmt. But debtors rising again.
11. P&L Breakdown – Show Me the Money
Metric | Mar 2023 | Mar 2024 | Mar 2025 |
---|---|---|---|
Sales | ₹27 Cr | ₹41 Cr | ₹165 Cr |
Operating Profit | ₹2 Cr | ₹3 Cr | ₹19 Cr |
Net Profit | ₹1 Cr | ₹1 Cr | ₹12 Cr |
OPM % | 7% | 7% | 11.4% |
PAT Margin | 4% | 2.4% | 7.2% |
Insane topline and bottom-line expansion in just one year – this is what IPO money is supposed to do.
12. Peer Comparison
Name | P/E | ROE % | OPM % | Market Cap (₹ Cr) |
---|---|---|---|---|
GSM Foils | 20.1 | 45.7 | 11.4 | 243 |
EPL Ltd | 20.7 | 16.3 | 19.8 | 7,506 |
TCPL Packaging | 24.5 | 23.8 | 16.9 | 3,443 |
Cosmo First | 22.9 | 9.3 | 9.9 | 2,984 |
Polyplex | 17.0 | 5.8 | 10.1 | 3,563 |
GSM’s financial ratios punch way above its market cap weight. But scale and consistency remain question marks.
13. EduInvesting Verdict™
GSM Foils is what you get when:
- A tiny company gets massive growth capital
- Executes like a beast
- Keeps reinvesting instead of showing off with dividends
But:
- Working capital stress
- Cash flow issues
- Valuation nearing full
Still, as far as shiny wrappers go, GSM isn’t just packaging… it might be delivering something truly valuable underneath.
Metadata
– Written by EduInvesting | July 20, 2025
– Tags: GSM Foils, Pharma Packaging, Aluminium, Smallcap Stocks, Q1 FY26 Earnings