1. At a Glance
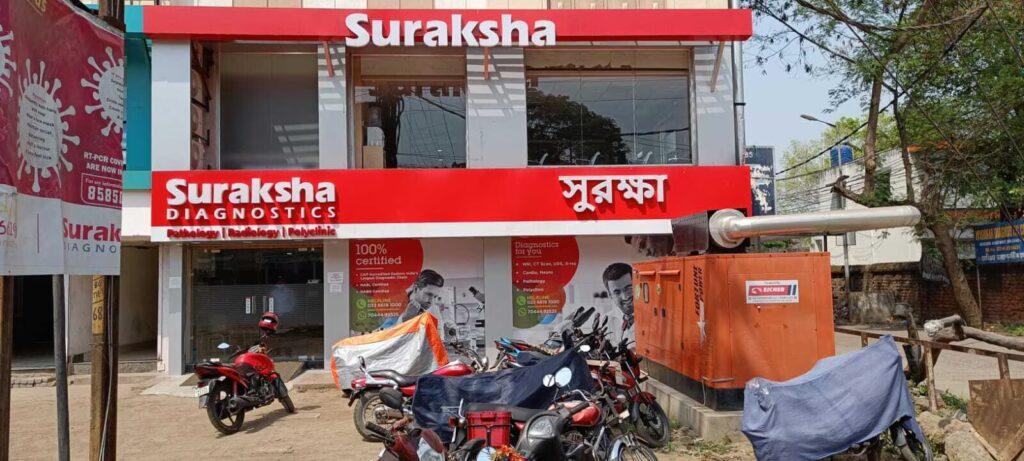
Suraksha Diagnostic isn’t your average lab test center—it’s Eastern India’s diagnostic kingpin with a hub-and-spoke model, 2,300+ tests, and a dominant 95% revenue contribution from West Bengal. But can it diversify beyond its Kolkata comfort zone?
2. Introduction with Hook
Imagine a cricket team scoring centuries in their home stadium every match but struggling to bat on away pitches. That’s Suraksha Diagnostic in the diagnostics IPL—formidable at home, but expansion is the ultimate final frontier.
- Market Share in East India: 1.3%
- Revenue FY25: ₹252 Cr (up 15%)
- PAT FY25: ₹31 Cr (up 34%)
With a ₹1,600 Cr market cap and PE of 53.8x, the market clearly thinks this lab rat has more runs to make. But is the innings sustainable?
3. Business Model (WTF Do They Even Do?)
Suraksha is a fully integrated diagnostics service provider. Here’s their working style decoded:
- Hub-and-Spoke Model:
Central lab + 8 satellite labs + 100+ collection centers. - Service Segments:
- Pathology: 1,452 total tests
- Radiology: 885 types, including MRI & CT
- Consultation: Polyclinic services with 750+ doctors
- Omni-channel:
Combines in-person and digital consultations—swab in Kolkata, report on your phone in Assam. - B2C-Focused:
Individual patients contribute ~90% of the revenue (low B2B reliance).
4. Financials Overview
Profit & Loss (₹ in Cr):
| Year | Revenue | EBITDA | PAT | EPS | OPM % |
|---|---|---|---|---|---|
| FY21 | 140 | 25 | 6 | 93.33 | 18% |
| FY22 | 223 | 48 | 24 | 344.2 | 22% |
| FY23 | 190 | 47 | 6 | 94.49 | 25% |
| FY24 | 219 | 73 | 23 | 342.46 | 33% |
| FY25 | 252 | 81 | 31 | 6.11 | 32% |
Key notes:
- PAT up 34% YoY in FY25
- EPS reset due to equity base change (from ₹220+ to ₹6.11)
- Strong OPM >30% despite expansion
5. Valuation
Fair Value Range Estimate:
| Methodology | FV Range (₹) |
|---|---|
| PE Multiple (30x–40x on FY26E EPS ~₹8.5) | ₹255 – ₹340 |
| EV/EBITDA (18x on FY26E EBITDA ₹100 Cr) | ₹300 – ₹375 |
| DCF (Aggressive 15% CAGR, 10yr) | ₹310 – ₹360 |
EduVal™ Verdict:
At ₹320, the stock is hovering at the upper end of fair value. No screaming bargain, but not an overpriced fad either.
6. What’s Cooking – News, Triggers, Drama
- Expansion Blitzkrieg:
15–18 new centers coming in FY26. - Acquisition of Fetomat Wellness:
63% stake acquired to enter prenatal diagnostics—new growth vector unlocked. - Genomics Lab Launch (July 2025):
₹22 Cr spent, ₹46 Cr more planned. Targeting advanced diagnostics leadership in East India. - Management Shuffle:
New CFO appointed after former CFO + COO quit in Q4 FY25. Transition time, not turmoil (yet).
7. Balance Sheet
FY25 Snapshot (₹ Cr)
| Metric | Value |
|---|---|
| Equity Capital | 10 |
| Reserves | 201 |
| Total Borrowings | 89 |
| Total Liabilities | 334 |
| Fixed Assets | 223 |
| Investments | 1 |
| Cash & Others | 110 |
Key Insights:
- Debt has come down from ₹99 Cr in FY23 to ₹89 Cr.
- Assets largely productive (fixed assets + labs), not sitting in real estate or goodwill.
8. Cash Flow – Sab Number Game Hai
| Year | CFO | CFI | CFF | Net Cash |
|---|---|---|---|---|
| FY21 | 24 | -28 | 3 | -1 |
| FY22 | 42 | -44 | 1 | -0 |
| FY23 | 44 | -21 | -24 | -1 |
| FY24 | 60 | -35 | -25 | 0 |
| FY25 | 63 | -40 | -24 | -0 |
Translation:
Operations are healthy. Growth is capex-funded. No reckless expansion. No dividend, no drama.
9. Ratios – Sexy or Stressy?
| Metric | FY23 | FY24 | FY25 |
|---|---|---|---|
| ROCE | 9% | 17% | 18% |
| ROE | 6% | 15.9% | 16% |
| OPM % | 25% | 33% | 32% |
| D/E Ratio | 0.66 | 0.53 | 0.44 |
| Inventory Days | 82 | 89 | 100 |
| Debtor Days | 9 | 15 | 20 |
Verdict:
Margins are a plus. Working capital efficiency? Meh.
10. P&L Breakdown – Show Me the Money
| Quarter | Sales | EBITDA | PAT | EPS | OPM % |
|---|---|---|---|---|---|
| Jun 24 | 60.7 | 20.6 | 7.67 | 1.84 | 34% |
| Sep 24 | 66.7 | 23.2 | 10.15 | 2.40 | 35% |
| Dec 24 | 59.5 | 18.3 | 5.98 | 1.18 | 31% |
| Mar 25 | 65.1 | 19.2 | 7.17 | 1.42 | 29% |
Consistency is decent; margins fluctuate but don’t collapse.
11. Peer Comparison
| Company | CMP | MCap | PE | ROCE | PAT (₹ Cr) | OPM% | Sales (₹ Cr) |
|---|---|---|---|---|---|---|---|
| Dr Lal Pathlabs | 3,003 | 25,162 | 51.5 | 28.9 | 488.7 | 28.3 | 2,461 |
| Vijaya Diagnostics | 1,028 | 10,558 | 73.4 | 21.7 | 143.9 | 40.1 | 681 |
| Metropolis Health | 1,939 | 10,042 | 69.3 | 14.8 | 145 | 22.8 | 1,331 |
| Krsnaa Diagnostics | 846 | 2,743 | 33.1 | 13.0 | 82.8 | 28.9 | 681 |
| Suraksha | 320 | 1,665 | 53.8 | 17.5 | 31 | 32.2 | 252 |
Takeaway:
Not the biggest, not the cheapest. But strong margin profile for its size.
12. Miscellaneous – Shareholding, Promoters
| Category | Mar 25 | Jun 25 |
|---|---|---|
| Promoters | 48.78% | 48.88% |
| FIIs | 14.46% | 13.95% |
| DIIs | 22.05% | 22.37% |
| Public | 14.71% | 14.80% |
No promoter pledging. FII holding slightly decreasing. DII trust is stable.
13. EduInvesting Verdict™
Suraksha Diagnostic is quietly building Eastern India’s most advanced diagnostics empire. With a moat in high-margin radiology, a genomics push, and B2C dominance, the ingredients are compelling. But geographic concentration and valuation multiples demand caution.
Is it scalable? Probably.
Is it cheap? Not exactly.
Is it boring? Definitely not.
Metadata
– Written by EduInvesting | 20 July 2025
– Tags: diagnostics, suraksha, IPO watch, lab testing, radiology, healthtech, B2C healthcare, pathlab, genomics, fetomat, Bengal healthcare


