1. At a Glance
Ellenbarrie Industrial Gases has gone from -₹41 EPS to India’s only 100% Indian-owned multi-gas empire. But with a 97 P/E and zero dividends, is it bottling profits or just hyping helium?
2. Introduction with Hook
Imagine if Biryani, Bisleri, and Bharat Gas merged into one company that didn’t believe in giving dividends but loved oxygen. That’s Ellenbarrie — the quiet monarch of industrial and medical gases in India.
- FY25 Net Profit: ₹83 Cr (up 84%)
- FY25 Revenue: ₹312 Cr
- P/E: 96.8 | ROE: 17.8%
- Largest Indian-owned industrial gas player
The only gas here is not hot air — it’s nitrogen, argon, and CO₂… with valuation to match.
3. Business Model (WTF Do They Even Do?)
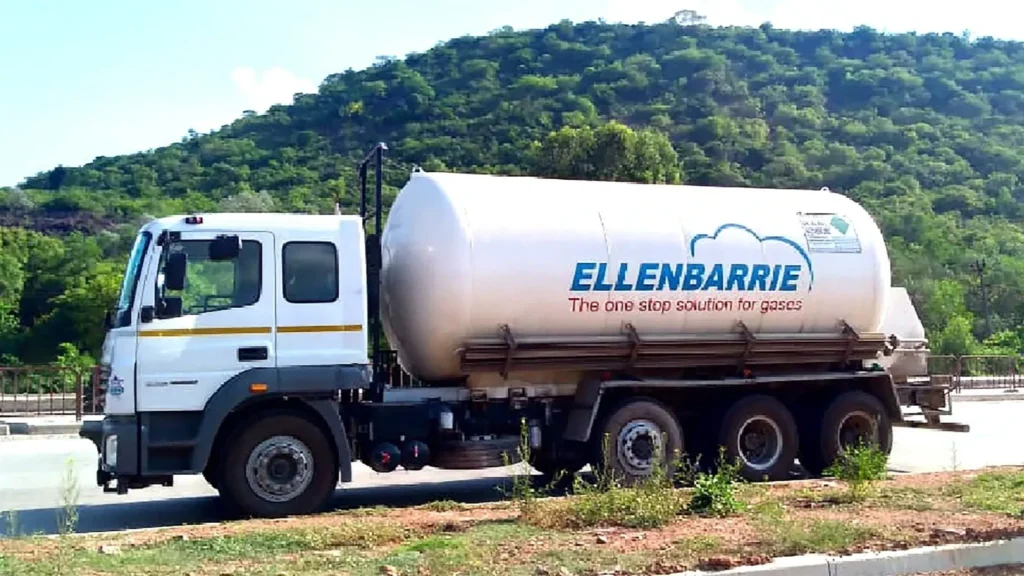
Ellenbarrie is in the business of gases. No jokes, literally.
What they supply:
- Industrial Gases: Oxygen, Nitrogen, Argon, Helium, Acetylene
- Medical Gases: O₂, N₂O
- Specialty Gases: Welding mixtures, dry ice, synthetic air
- Target Sectors: Steel, Healthcare, Defence, Energy, Construction
Delivery Format:
- Bulk (tankers)
- Packaged (cylinders)
- On-site solutions
In a world obsessed with SaaS, Ellenbarrie runs on GOaS — Gas on a Supply-chain.
4. Financials Overview
| Metric | FY23 | FY24 | FY25 |
|---|---|---|---|
| Revenue (₹ Cr) | 205 | 269 | 312 |
| EBITDA (₹ Cr) | 34 | 62 | 110 |
| Net Profit (₹ Cr) | 28 | 45 | 83 |
| ROCE (%) | 8% | 13% | 18.2% |
| ROE (%) | 8.3% | 12.5% | 17.8% |
| Debt (₹ Cr) | 102 | 178 | 247 |
YoY Growth FY25:
- Revenue +16%
- Net Profit +84%
- EBITDA Margin: Jumped from 23% to 35%
5. Valuation
A. P/E Based:
- EPS (FY25): ₹6.36
- Fair P/E for industry: 35–45x
- FV Range = ₹223 – ₹286
B. EV/EBITDA Based:
- FY25 EBITDA: ₹110 Cr
- EV/EBITDA Range: 15–20x
- EV: ₹1,650 – ₹2,200 Cr
- Net Debt: ~₹150 Cr
- Equity Value = ₹1,500 – ₹2,050 Cr
- FV/share: ₹270 – ₹370 (post dilution)
C. P/BV Based:
- Book Value: ₹37.7
- CMP/BV: 14.6x
- Reasonable Range: 5–8x → FV Range: ₹190 – ₹300
Fair Value Range: ₹230 – ₹300
(Yes, you’re overpaying at ₹550. Unless the gas is actually laughing gas.)
6. What’s Cooking – News, Triggers, Drama
🔥 Q4 FY25: Record PAT ₹83 Cr
🧪 Expansion Capex: CWIP ₹45 Cr → new capacity coming
🧨 IPO Fever: Listed in July 2025; stock up 30% since
📉 Valuation Bubble?: Trades at 97x — even Linde India is cheaper
🫥 Negatives: No dividends, high debtor days, rising debt
7. Balance Sheet
| Metric | FY23 | FY24 | FY25 |
|---|---|---|---|
| Equity (₹ Cr) | 7 | 7 | 26 |
| Reserves (₹ Cr) | 357 | 403 | 467 |
| Borrowings (₹ Cr) | 102 | 178 | 247 |
| CWIP (₹ Cr) | 74 | — | 45 |
| Net Worth (₹ Cr) | 364 | 410 | 493 |
| Total Assets (₹ Cr) | 551 | 673 | 846 |
Insights:
- Borrowings up 42% YoY
- Net worth has doubled in 3 years
- Capital being deployed → CWIP will fuel FY26 growth
8. Cash Flow – Sab Number Game Hai
| Metric | FY23 | FY24 | FY25 |
|---|---|---|---|
| CFO (₹ Cr) | 39 | 44 | 4 |
| CFI (Investing) (₹ Cr) | -114 | -122 | -57 |
| CFF (Financing) (₹ Cr) | 87 | 67 | 52 |
| Net Cash Flow (₹ Cr) | 11 | -10 | -1 |
Narrative:
- Operating cash dried up in FY25 despite profits → WC stress
- Negative free cash flow = Capex heavy year
- Funded via increased borrowings
9. Ratios – Sexy or Stressy?
| Ratio | FY23 | FY24 | FY25 |
|---|---|---|---|
| ROCE (%) | 8% | 13% | 18.2% |
| ROE (%) | 8.3% | 12.5% | 17.8% |
| Debtor Days | 70 | 61 | 97 |
| Inventory Days | 119 | 73 | 145 |
| CCC (Days) | -60 | 17 | 98 |
| Working Cap Days | 53 | 48 | 82 |
Verdict:
ROCE is hot, but debtor days and inventory ballooned in FY25. CFO collapse is not a great look.
10. P&L Breakdown – Show Me the Money
| Metric | FY23 | FY24 | FY25 |
|---|---|---|---|
| Revenue (₹ Cr) | 205 | 269 | 312 |
| EBITDA (₹ Cr) | 34 | 62 | 110 |
| EBITDA Margin (%) | 16% | 23% | 35% |
| Net Profit (₹ Cr) | 28 | 45 | 83 |
| EPS (₹) | 42.98 | 69.18 | 6.36 (post split) |
Note: EPS dropped due to equity capital increase from ₹7 Cr → ₹26 Cr post-listing.
But in ₹ terms, PAT doubled in 2 years. That’s real.
11. Peer Comparison
| Company | CMP ₹ | P/E | ROCE % | PAT (Cr) | Sales (Cr) | OPM % | CMP/BV | ROE % |
|---|---|---|---|---|---|---|---|---|
| Linde India | 6,704 | 127.6 | 17.0 | 448 | 2,485 | 31% | 15.1 | 12.4 |
| Ellenbarrie | 551 | 96.8 | 18.2 | 83 | 312 | 35% | 14.6 | 17.8 |
| Refex Industries | 437 | 29.8 | 25.3 | 189 | 2,430 | 9% | 4.5 | 22.0 |
| Stallion India | 104 | 25.5 | 20.0 | 32 | 377 | 12% | 2.7 | 15.4 |
Interpretation:
Ellenbarrie’s margins are elite. But valuation is ahead of its fundamentals. It’s more expensive than Linde India on every metric except market cap.
12. Miscellaneous – Shareholding, Promoters
| Stakeholder | Jul 2025 |
|---|---|
| Promoters | 77.16% |
| FIIs | 1.98% |
| DIIs | 10.63% |
| Public | 10.23% |
- Over 2 lakh shareholders
- No pledges
- Recently appointed Aditya Keshri as Compliance Officer
- KFinTech as RTA = smooth ops
- Recently listed (July 1, 2025)
13. EduInvesting Verdict™
Ellenbarrie is a niche monopoly with real cash-flow generation, elite margins, and aggressive growth via reinvestment. But Mr. Market has already priced it like it’s Linde 2.0.
At 97x earnings and 14.6x book, the oxygen is thin at this altitude. Still, in a country short of industrial gas suppliers, Ellenbarrie is a quiet power play.
Verdict:
Good business, great margins, over-excited valuation. If you’re holding it — inhale deeply. If you’re chasing it — better have a high-altitude mask.
Metadata
– Written by EduInvesting Research | 19 July 2025
– Tags: Ellenbarrie Industrial Gases, Oxygen Stocks, Industrial Gases, Specialty Chemicals, Indian Monopolies, Niche PSU Alternatives


