1. At a Glance
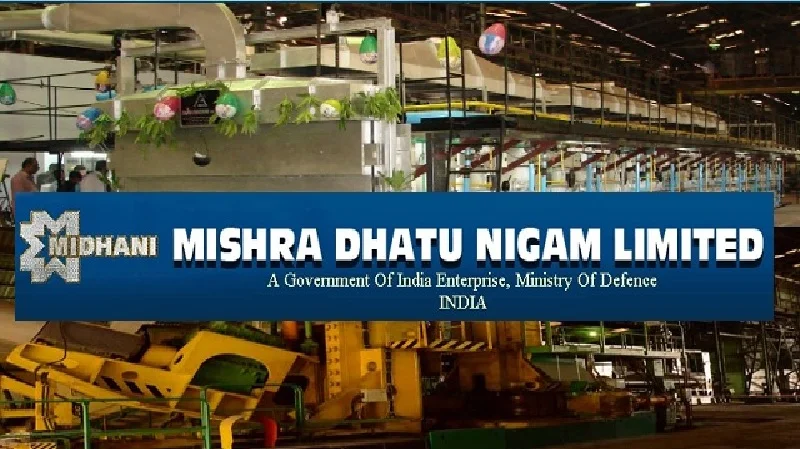
India’s only titanium alloy manufacturer, MIDHANI is a strategic jewel wrapped in bureaucracy and molten metal. With a P/E north of 70, order wins from ISRO and DRDO, and fines from SEBI, it’s as if HAL and BHEL had a startup baby in slow motion.
2. Introduction with Hook
Imagine a blacksmith working for the Defence Ministry, forging metals that power missiles, space rockets, and submarines — and occasionally missing compliance deadlines. That’s MIDHANI.
- GoI holds 74% — it’s a PSU in form and function
- Q4 FY25 profit: ₹56 Cr | FY25 sales: ₹1,074 Cr
- India’s only titanium alloy producer
But with 8% ROE, low revenue growth, and a P/E ratio trying to reach Mars, should we call it a defense gem or bureaucratic baggage?
3. Business Model (WTF Do They Even Do?)
MIDHANI is a critical defence PSU specializing in:
- Superalloys (Nickel-based, Cobalt-based)
- Titanium alloys
- Soft magnetic alloys
- Special steels
Primary End Customers:
- DRDO
- ISRO
- BDL
- Indian Navy / Army / Air Force
- Nuclear Power Corp
- Hindustan Aeronautics
Key Value Add: Metallurgy + Strategic Relevance = Monopolistic Utility.
But monopoly without execution is just… monopoly.
4. Financials Overview
| Metric | FY23 | FY24 | FY25 |
|---|---|---|---|
| Revenue (₹ Cr) | 872 | 1,073 | 1,074 |
| EBITDA (₹ Cr) | 259 | 195 | 218 |
| Net Profit (₹ Cr) | 156 | 91 | 110 |
| ROCE (%) | 15% | 9% | 11% |
| Debt (₹ Cr) | 489 | 433 | 350 |
| Cash Flow from Ops (₹ Cr) | 5 | 216 | 217 |
Highlights:
- Revenue growth is flatter than a dosa — just 0% YoY in FY25
- Operating margin fell from 30% to ~20%
- Net profits improved in FY25, but still far from FY22 glory
- Massive inventory = capital lockup
5. Valuation
A. P/E Based:
- EPS FY25 = ₹5.88
- Peer average P/E = 45–60x
- Fair Value Range: ₹265 – ₹355
B. P/BV Based:
- BV = ₹75.5
- Stock trades at 5.5x BV = richly valued
- P/B acceptable range: 3.5–4.5x
- FV Range: ₹260 – ₹340
C. EV/EBITDA Based:
- EBITDA: ₹218 Cr
- EV/EBITDA Range: 15–18x
- EV Range: ₹3,270 – ₹3,920 Cr
- Net Debt: ~₹325 Cr
- Equity Value: ₹2,945 – ₹3,595 Cr
- Per Share: ₹314 – ₹383
Final Fair Value Range: ₹275 – ₹360
(Assumes execution picks up, order book monetizes)
6. What’s Cooking – News, Triggers, Drama
🔥 Recent Orders:
- Aug ’24: ₹285 Cr order
- Dec ’23: ₹357 Cr order
- Involved in Aditya-L1 and Chandrayaan-3 mission
📉 Negative PR:
- Multiple SEBI & stock exchange fines (non-compliance)
- Delays in independent director appointments
- Sluggish execution despite healthy order wins
🧪 Strategic Moves:
- JV for Advanced Materials Testing Foundation
- MoU for Engine Systems with foreign partners
- CMD shuffle: Dr. S.V.S. Narayana Murty took charge Apr ’25
7. Balance Sheet
| Metric | FY23 | FY24 | FY25 |
|---|---|---|---|
| Equity Capital (₹ Cr) | 187 | 187 | 187 |
| Reserves (₹ Cr) | 1,099 | 1,132 | 1,227 |
| Borrowings (₹ Cr) | 489 | 433 | 350 |
| Total Liabilities (₹ Cr) | 2,864 | 2,906 | 2,914 |
| Net Worth (₹ Cr) | 1,286 | 1,319 | 1,414 |
Key Points:
- Debt is reducing, but cash locked in working capital
- CWIP has dropped from ₹549 Cr (FY21) → ₹25 Cr (FY25)
- Fixed Assets mostly deployed — new capex cycle yet to start
8. Cash Flow – Sab Number Game Hai
| Metric | FY23 | FY24 | FY25 |
|---|---|---|---|
| CFO (₹ Cr) | -35 | 216 | 217 |
| CFI (Investing, ₹ Cr) | -3 | -65 | -96 |
| CFF (Financing, ₹ Cr) | 43 | -148 | -126 |
| Net Cash Flow (₹ Cr) | 4 | 2 | -6 |
Interpretation:
- Operating cash finally normalized post FY23 chaos
- Investing remains low (no new factories yet)
- Debt repayment seen in financing cash flow
9. Ratios – Sexy or Stressy?
| Ratio | FY23 | FY24 | FY25 |
|---|---|---|---|
| ROCE (%) | 15 | 9 | 11 |
| ROE (%) | 8.3 | 4.9 | 8.0 |
| Inventory Days | 2,088 | — | 1,086 |
| Debtor Days | 132 | 110 | 139 |
| CCC (Days) | 1,882 | 110 | 1,146 |
| WC Days | 531 | 431 | 435 |
| P/E Ratio | — | — | 71.4 |
Verdict:
Inventory is eating working capital like a hungry hippo. Unless that’s addressed, ROE will remain mediocre. ROCE still in double digits though.
10. P&L Breakdown – Show Me the Money
| Metric | FY23 | FY24 | FY25 |
|---|---|---|---|
| Sales (₹ Cr) | 872 | 1,073 | 1,074 |
| EBITDA (₹ Cr) | 259 | 195 | 218 |
| Depreciation (₹ Cr) | 53 | 59 | 63 |
| Interest (₹ Cr) | 27 | 35 | 29 |
| Other Income (₹ Cr) | 38 | 30 | 31 |
| Net Profit (₹ Cr) | 156 | 91 | 110 |
| EPS (₹) | 8.32 | 4.87 | 5.88 |
Commentary:
- FY25 is a bounce-back year after FY24 margin slump
- EPS recovered to near 6, but needs >₹10 to justify current P/E
- Other income remains a meaningful contributor (~28%)
11. Peer Comparison
| Company | CMP ₹ | P/E | ROCE % | Net Profit (Cr) | Sales (Cr) | ROE % | CMP/BV |
|---|---|---|---|---|---|---|---|
| HAL | 4,651 | 37.2 | 33 | 8,359 | 30,981 | 26.1 | 8.89 |
| BEL | 395 | 54.2 | 39 | 5,321 | 23,768 | 29.3 | 14.45 |
| BDL | 1,672 | 111 | 20 | 549 | 3,345 | 14.4 | 15.28 |
| Data Patterns | 2,758 | 71.8 | 21 | 215 | 708 | 15.2 | 10.2 |
| Mishra Dhatu Nigam | 419 | 71.4 | 11 | 110 | 1,074 | 8.05 | 5.55 |
Conclusion:
MIDHANI trades at higher multiples despite significantly lower margins & growth than HAL/BEL. Overvaluation? Possibly. But its monopoly on titanium alloys keeps the narrative hot.
12. Miscellaneous – Shareholding, Promoters
| Stakeholder | Jun ’24 |
|---|---|
| Promoters | 74.00% |
| FIIs | 1.65% |
| DIIs | 8.79% |
| Public | 15.55% |
Buzz:
- FII stake rising slowly = mild international interest
- Number of shareholders up from 85k to 1.57 lakh in 2 years
- No pledges. PSU style capital stability, but speed? Not so much.
13. EduInvesting Verdict™
MIDHANI is like an ancient anvil — solid, slow, reliable, and capable of handling extreme pressure. But in a hypergrowth market, can it keep up? Orders are flowing, but execution is erratic, margins are inconsistent, and compliance seems optional at times.
Until titanium demand explodes (which it might with new-gen defence systems), MIDHANI remains a niche monopolist with PSU drag. The stock trades at a valuation meant for HAL, but without the velocity.
Verdict: Strategic? Yes. Sexy? Not yet.
Watch out for earnings acceleration. Or fines.
Metadata
– Written by EduInvesting Research | 19 July 2025
– Tags: MIDHANI, Titanium Alloys, Defence PSU, Strategic Materials, Special Steels, Govt of India Undertaking


