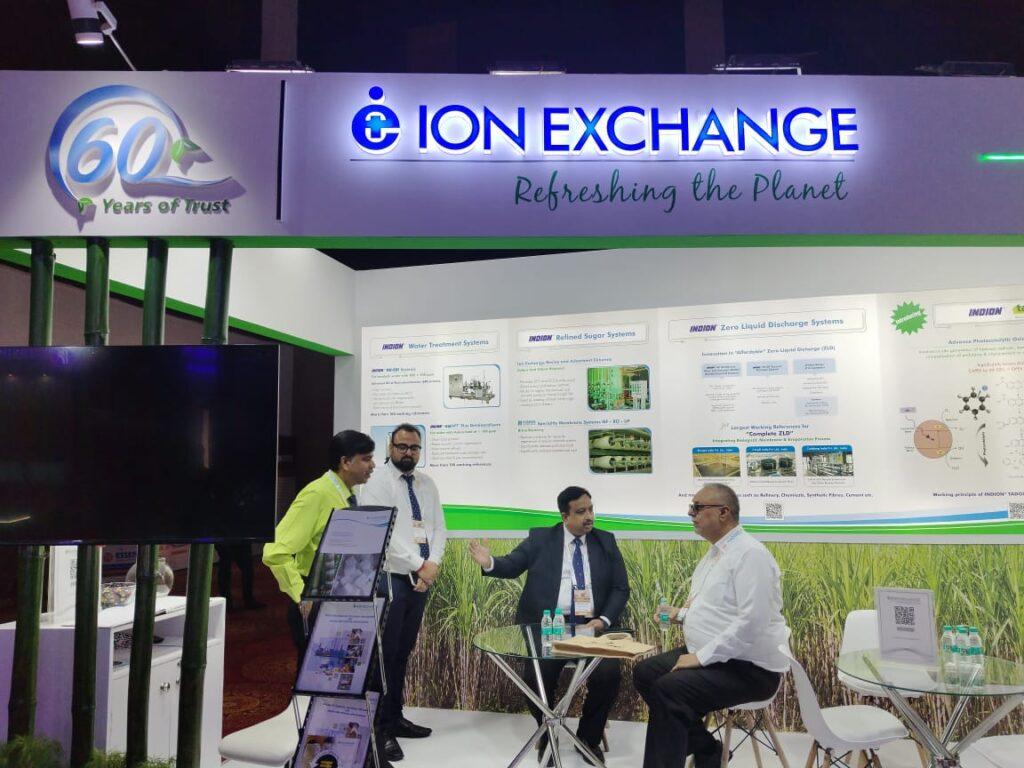
1. At a Glance
Ion Exchange is India’s original water treatment warrior—doing desalination, ZLD, sewage, EPC, chemicals, and bottled water plants long before ESG was cool. But beneath the surface of ₹2,737 Cr revenue lies a debtors’ swamp, low promoter skin, and working capital that screams “tanker delivery delayed.”
2. Introduction with Hook
Imagine running a business that literally purifies water—but your balance sheet has 151 days of receivables. That’s Ion Exchange. A 60-year-old veteran cleaning India’s dirtiest effluents, while wading through government contract delays and debtor ghosting.
- FY25 Net Profit: ₹208 Cr
- ROCE: 22.1% (clean)
- Debtor Days: 151 (very, very murky)
3. Business Model (WTF Do They Even Do?)
Ion Exchange offers literally everything related to water, including:
- Engineering (~58%): EPC for water/wastewater treatment, desalination, ZLD
- Chemicals (~30%): Resins, treatment chemicals
- Consumer/Service (~12%): Domestic filtration, industrial AMC, containerized plants
Core customers: Power, Pharma, Refineries, Infra, Government agencies (aka slow payers)
Moats: Technical IP, global presence, 100K+ installs, and every buzzword from ESG to UN SDGs.
4. Financials Overview
| Year | Revenue (₹ Cr) | Net Profit (₹ Cr) | OPM (%) | EPS (₹) |
|---|---|---|---|---|
| FY21 | ₹1,450 | ₹143 | 14% | 9.81 |
| FY22 | ₹1,577 | ₹162 | 14% | 11.10 |
| FY23 | ₹1,990 | ₹195 | 13% | 13.41 |
| FY24 | ₹2,348 | ₹195 | 12% | 13.37 |
| FY25 | ₹2,737 | ₹208 | 11% | 14.17 |
Verdict: Steady grower. Profits inching up. Margins dipping, possibly due to EPC share + receivable drag.
5. Valuation
CMP ₹548. EPS ₹14.17 → P/E: 38.7x
Book Value ₹82.4 → P/BV: 6.6x
EduInvesting Fair Value Range (FY26E):
- Bear Case (EPC slowdown + poor collections): ₹420
- Base Case (15% growth, 30x PE): ₹570
- Bull Case (execution surge + chemical uptick): ₹690
Conclusion: Pricing in “sustainable engineering” future. But margin fragility = slippery slope.
6. What’s Cooking – News, Triggers, Drama
- Major Orders from Adani, ADNOC, African & Middle East governments
- Litigation Hit: ₹17.5 Cr payout ordered, another ₹22 Cr deposit by SEBI on subsidiary
- NCLT Approves Amalgamation of Subsidiaries—business simplification
- Debtor days at 151—worse than a monsoon project in UP
- Q1 FY25 EBIT up 26% YoY, execution picking pace
7. Balance Sheet
| Particulars | FY23 | FY24 | FY25 |
|---|---|---|---|
| Equity Capital | ₹14 Cr | ₹14 Cr | ₹14 Cr |
| Reserves | ₹819 Cr | ₹1,004 Cr | ₹1,194 Cr |
| Total Borrowings | ₹59 Cr | ₹152 Cr | ₹323 Cr |
| Net Worth | ₹833 Cr | ₹1,018 Cr | ₹1,208 Cr |
| Total Assets | ₹1,939 Cr | ₹2,441 Cr | ₹2,987 Cr |
Red Flag: Debt doubled in FY25, probably to float EPC working capital. Interest costs rising—time to start collecting those bills.
8. Cash Flow – Sab Number Game Hai
| Year | CFO (₹ Cr) | CFI (₹ Cr) | CFF (₹ Cr) | Net Cash |
|---|---|---|---|---|
| FY23 | ₹63 | -₹41 | -₹15 | ₹6 |
| FY24 | ₹130 | -₹160 | ₹8 | -₹22 |
| FY25 | ₹32 | -₹165 | ₹128 | -₹4 |
Insight: Free cash flow is not free. FY25 saw working capital spike and capex climb—hence, borrowings + debt servicing.
9. Ratios – Sexy or Stressy?
| Metric | FY23 | FY24 | FY25 |
|---|---|---|---|
| ROCE | 34% | 27% | 22% |
| ROE | 13.4% | 13.4% | 18.7% |
| OPM | 13% | 12% | 11% |
| Debtor Days | 128 | 145 | 151 |
Conclusion: Financial performance is clean—but working capital isn’t. ROCE dilution = execution pace vs money stuck with clients.
10. P&L Breakdown – Show Me the Money
| Item | FY23 | FY24 | FY25 |
|---|---|---|---|
| Revenue | ₹1,990 Cr | ₹2,348 Cr | ₹2,737 Cr |
| EBITDA | ₹258 Cr | ₹275 Cr | ₹294 Cr |
| Net Profit | ₹195 Cr | ₹195 Cr | ₹208 Cr |
| EPS | ₹13.41 | ₹13.37 | ₹14.17 |
Stable. Safe. Predictable. Like a municipal water supply—when it works.
11. Peer Comparison
| Company | ROCE | P/E | OPM | Mcap (Cr) | Promoter Holding |
|---|---|---|---|---|---|
| VA Tech Wabag | 20.0% | 31x | 12.8% | ₹9,240 | 22.4% |
| Ion Exchange | 22.1% | 38x | 10.7% | ₹8,044 | 25.8% |
| Enviro Infra | 31.7% | 28x | 25.1% | ₹5,009 | 56.0% |
Conclusion: Ion has better stability than VA Tech, but weaker margins. Lowest promoter holding among the three.
12. Miscellaneous – Shareholding, Promoters
- Promoters: Just 25.76%, slowly declining
- FIIs: 5.5%
- DIIs: 13.88%
- Public: 38.69%
Observation: Classic institutional darling, promoter not too clingy. Retail catching up (128K shareholders).
13. EduInvesting Verdict™
Ion Exchange is a veteran in an industry that’s finally sexy—water treatment, desalination, ZLD, ESG, sustainability. But while order inflows are high, execution speed is moderate, and cash collection is glacial.
It’s not a startup. It’s not a scam. It’s a midcap stalwart that looks like it belongs in a UN water summit and a forensic audit—both at once.
TL;DR: Blue business, green vision, red flags in receivables. Still, one of the cleanest plays in India’s dirtiest sector.
Metadata
– Written by EduInvesting | 19 July 2025
– Tags: Ion Exchange, Water Stocks, ESG, Engineering, Desalination, Infrastructure, Environmental Tech, Zero Liquid Discharge, Utilities, Wabag Peers
