1. At a Glance
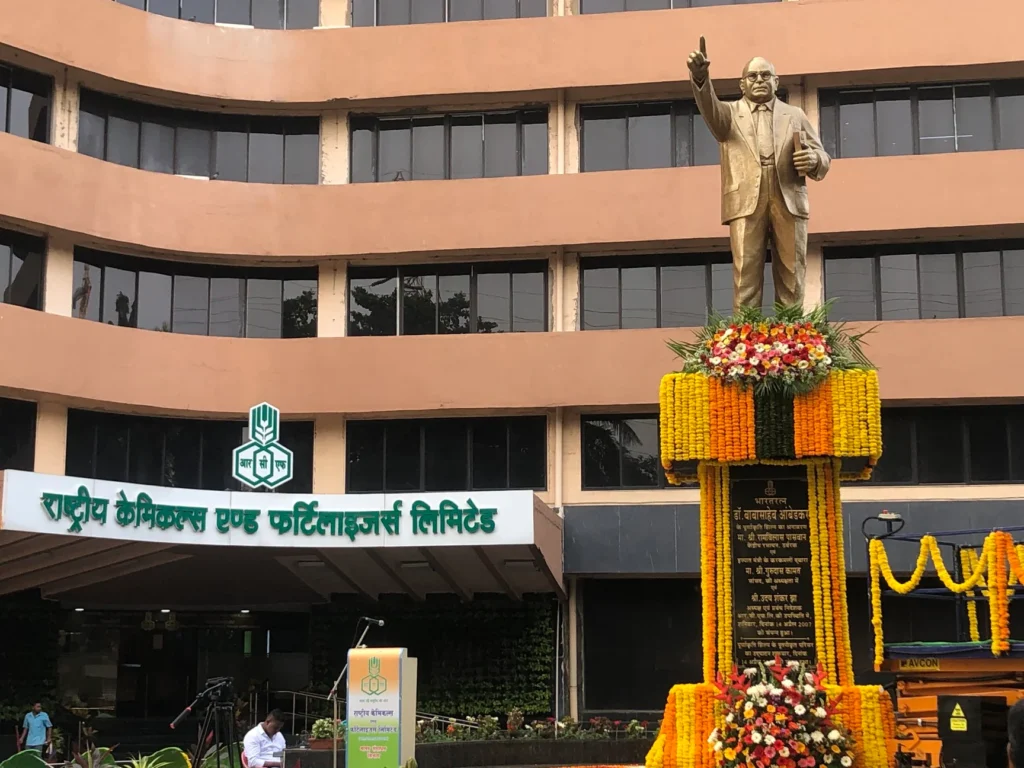
RCF is a government-owned PSU making fertilizers and industrial chemicals. With ₹16,934 Cr in FY25 revenue, it looks huge. But hold up—profit margins are microscopic, and growth is gasping for air (kind of like its plants in Mumbai traffic).
2. Introduction with Hook
Picture a 1980s scooter—sturdy, iconic, and painfully slow. That’s RCF. A CPSE with over 40 years of history, backed by GOI’s 75% hug, and producing the very stuff that feeds India. Yet, every quarter, its profits either vanish in a whiff of ammonia or get eaten by subsidy delays.
- 75% Government ownership—hello babu-driven decisions
- 10-year profit CAGR: -4%. Not a typo. Negative.
- FY25 OPM: 4%. Again, not a typo.
3. Business Model (WTF Do They Even Do?)
RCF operates in two divisions:
- Fertilizers (~80% Revenue)
- Urea (branded as “Ujjwala”), Complex fertilizers like Suphala
- Subsidy-dependent, volume-driven, and policy-handcuffed
- Industrial Chemicals (~20%)
- Methanol, Ammonia, Nitric Acid, Sodium Nitrate
- These make money when oil prices fall and disappear when they rise
Revenue Drivers: GOI subsidies, international urea prices, monsoon blessings, and… divine intervention
4. Financials Overview
| Year | Revenue (₹ Cr) | Net Profit (₹ Cr) | OPM (%) | EPS (₹) |
|---|---|---|---|---|
| FY21 | 8,281 | 384 | 9% | 6.96 |
| FY22 | 12,812 | 702 | 8% | 12.73 |
| FY23 | 21,452 | 966 | 7% | 17.52 |
| FY24 | 16,981 | 225 | 3% | 4.08 |
| FY25 | 16,934 | 242 | 4% | 4.39 |
Verdict: From ₹966 Cr PAT in FY23 to ₹242 Cr in FY25. That’s not a fall. That’s fertilizer-grade freefall.
5. Valuation
CMP ₹154. EPS ₹4.39 → P/E of 35x
Book Value: ₹86 → P/B = 1.79x
EduInvesting Fair Value Range (FY26E)
- Bear Case (Govt price caps, flat revenue): ₹85
- Base Case (marginal OPM revival): ₹130
- Bull Case (subsidy flush + chemical uptick): ₹170
Conclusion: PSU premium without PSU perks. Valuation inflated like a urea bag before elections.
6. What’s Cooking – News, Triggers, Drama
- ICRA reaffirmed AA Stable on ₹10,200 Cr of debt
- NCD Allotment in June 2025: ₹300 Cr @ 7.49%—decent rate, but why more debt?
- GM reshuffle: Babu out, babu in—no strategic shifts expected
- Demand Outlook: Patchy monsoon + political noise = fertilizer subsidy roulette
- Fact Check: FY25 dividend payout of 30% despite falling profits. Bribe to investors?
7. Balance Sheet
| Particulars | FY23 | FY24 | FY25 |
|---|---|---|---|
| Equity Capital | ₹552 Cr | ₹552 Cr | ₹552 Cr |
| Reserves | ₹4,038 Cr | ₹4,054 Cr | ₹4,194 Cr |
| Total Borrowings | ₹1,877 Cr | ₹3,297 Cr | ₹2,762 Cr |
| Total Liabilities | ₹9,734 Cr | ₹11,477 Cr | ₹11,267 Cr |
| Net Worth | ₹4,590 Cr | ₹4,606 Cr | ₹4,746 Cr |
Red Flag: Debt surged 75% in FY24 and still stands high. And all this, for a company that earned less than 2% ROA.
8. Cash Flow – Sab Number Game Hai
| Year | CFO (₹ Cr) | CFI (₹ Cr) | CFF (₹ Cr) | Net Cash |
|---|---|---|---|---|
| FY23 | ₹787 | -₹316 | -₹1,560 | -₹1,088 |
| FY24 | -₹422 | -₹464 | ₹1,032 | ₹145 |
| FY25 | ₹2,364 | -₹681 | -₹853 | ₹831 |
Insight: FY25 CFO looks golden, but that’s likely delayed subsidy flows—not operational genius. Capex remains muted.
9. Ratios – Sexy or Stressy?
| Metric | FY23 | FY24 | FY25 |
|---|---|---|---|
| ROCE | 21% | 6% | 8% |
| ROE | 17.5% | 4.1% | 5.1% |
| OPM | 7% | 3% | 4% |
| Debt/Equity | 0.41 | 0.72 | 0.58 |
Diagnosis: Margins collapsed. ROE got kidney-punched. Debt shot up. But yes, AA rating is intact. Because: PSU.
10. P&L Breakdown – Show Me the Money
| Item | FY23 | FY24 | FY25 |
|---|---|---|---|
| Revenue | ₹21,452 Cr | ₹16,981 Cr | ₹16,934 Cr |
| EBITDA | ₹1,483 Cr | ₹520 Cr | ₹675 Cr |
| Net Profit | ₹966 Cr | ₹225 Cr | ₹242 Cr |
| EPS | ₹17.52 | ₹4.08 | ₹4.39 |
Key Insight: Sales are flatlining, but EPS is evaporating. It’s like watching a fertilizer bag leak overnight.
11. Peer Comparison
| Company | ROCE | P/E | OPM | Mcap (Cr) | Promoter Holding |
|---|---|---|---|---|---|
| Coromandel Int’l | 23.2% | 39.6x | 10.7% | ₹68,137 Cr | 57.3% |
| Chambal Fertilizer | 27.9% | 13.3x | 14.9% | ₹21,981 Cr | 60.6% |
| Paradeep Phosph. | 13.9% | 25.3x | 9.1% | ₹13,966 Cr | 56.4% |
| GSFC | 6.1% | 13.6x | 6.6% | ₹8,038 Cr | 37.8% |
| RCF | 7.5% | 35.5x | 4.0% | ₹8,500 Cr | 75.0% |
Conclusion: RCF trades at a premium P/E despite being bottom-of-the-pack in profitability. Must be that GOI charm.
12. Miscellaneous – Shareholding, Promoters
- Promoter (GOI): 75%
- FIIs: 2.28% (and slowly exiting)
- DIIs: 0.31%
- Public: 22.4%
No movement. No excitement. Just government… forever.
13. EduInvesting Verdict™
RCF is not a value trap. It’s a value museum—preserving old business models, subsidy-dependency, and PSU lethargy.
Yes, it produces essential agri-inputs. Yes, it’s “critical to food security.” But does that make it a great investment? Only if you’re into dividend scraps, 2% ROE, and watching CAPEX announcements that never materialize.
It’s not toxic. It’s just terminally boring.
Metadata
– Written by EduInvesting | 19 July 2025
– Tags: RCF, Fertilizer PSU, Chemicals, Government Companies, Rashtriya Chemicals, Dividend Stocks, CPSE
