1. At a Glance
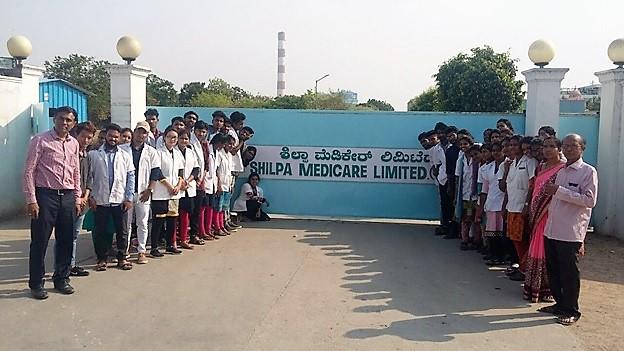
From zero to niche hero—Shilpa Medicare has built an oncology-focused API and formulations empire with global credentials. But while its pipes are full of regulatory approvals, its P&L still looks like it needs a dose of adrenaline. Welcome to the pharma stock that’s high on USFDA but low on ROE.
2. Introduction with Hook
Imagine you’re the world’s top student—certified by USFDA, EMA, TGA, Cofepris, PMDA, and your local society uncle. But every exam, you still score 40 out of 100.
That’s Shilpa Medicare for you:
- Approvals? Plenty.
- Global clients? Yep.
- PAT Margin? 6%.
- ROE? 4.3%.
And despite all this, the stock is up 45% in a year. Either the market knows something, or it just got too high on its own formulations.
3. Business Model (WTF Do They Even Do?)
Shilpa makes niche Active Pharmaceutical Ingredients (APIs) and formulations, mainly in oncology.
Segments:
- APIs & Intermediates: 30+ oncology APIs supplied globally
- Formulations: 16 injectable forms, 19 oral dosage forms, including cutting-edge delivery formats like oral disintegrating films
- CRAMS: Contract research and manufacturing services
- Biologics & Biosimilars: Through its subsidiaries (Shilpa Biologics, Biocare)
- Power Play: Vertically integrated manufacturing setup with 19 blocks—segregated for oncology and non-oncology
And yes, they’re one of the few Indian firms making recombinant human albumin in partnership with Finland’s Orion.
4. Financials Overview
| Year | Revenue (₹ Cr) | EBITDA (₹ Cr) | PAT (₹ Cr) | EPS (₹) | OPM % |
|---|---|---|---|---|---|
| FY22 | 1,141 | 202 | 61 | 6.99 | 18% |
| FY23 | 1,046 | 99 | -31 | -3.75 | 9% |
| FY24 | 1,146 | 239 | 32 | 3.67 | 21% |
| FY25 | 1,286 | 316 | 78 | 8.01 | 25% |
Key Trends:
- Sales CAGR (10Y): 8%
- PAT CAGR (10Y): 2%
- FY25 bounce-back from FY23 mess
- OPM expansion but still thin net margins due to high depreciation & interest
5. Valuation
Current Price: ₹916
P/E: 100 (because optimism is more potent than actual profits)
Valuation Methods:
- P/E based (on FY26E EPS of ₹14–₹18): 45–55x → FV Range: ₹630–₹990
- EV/EBITDA based (14–16x FY26E EBITDA): FV Range: ₹800–₹1,100
- DCF (assuming 10% CAGR & margin expansion): ₹750–₹900
EduInvesting FV Range: ₹750–₹1,000
Current market price = upper half of the range = priced for perfection.
6. What’s Cooking – News, Triggers, Drama
In the last 6 months:
- USFDA approvals for Unit VI + Varenicline tablets
- New CEO for Shilpa Pharma Lifesciences
- GMP approvals from EMA & Austria with zero observations
- Exclusive tie-up with Orion Corp (Finland) for recombinant human albumin
- Launched Bortezomib (BORUZU) in US
Red Flags:
- High capex but slow returns
- Promoter holding dropped 6% in 2 years
- ROCE still just 8% after decades in business
This is either a brewing turnaround or just a very long story with no climax.
7. Balance Sheet
| Particulars | FY25 (₹ Cr) |
|---|---|
| Equity Capital | 10 |
| Reserves | 2,362 |
| Borrowings | 588 |
| Other Liabilities | 351 |
| Total Liabilities | 3,311 |
| Fixed Assets | 1,777 |
| CWIP | 463 |
| Investments | 35 |
| Other Assets | 1,037 |
Key Points:
- Net debt: ~₹550 Cr = not negligible
- Massive ₹463 Cr stuck in CWIP
- Reserves have grown, but returns on them haven’t
8. Cash Flow – Sab Number Game Hai
| Year | CFO (₹ Cr) | CFI (₹ Cr) | CFF (₹ Cr) | Net Flow |
|---|---|---|---|---|
| FY22 | 105 | -286 | +83 | -98 |
| FY23 | 180 | -232 | +46 | -7 |
| FY24 | 135 | -171 | +47 | +11 |
| FY25 | 132 | -199 | +63 | -4 |
Insights:
- Operating cash flow is healthy but dwarfed by capex
- Negative free cash flow trend since FY21
- High reinvestment phase—could pay off or burn capital
9. Ratios – Sexy or Stressy?
| Ratio | FY25 |
|---|---|
| ROCE | 8% |
| ROE | 4.3% |
| OPM | 25% |
| Debt/Equity | ~0.25 |
| Inventory Days | 309 |
| CCC (Days) | 350 |
| P/E | 100 |
Verdict:
Balance sheet is fine. P&L? Meh. Inventory? Feels like they’re hoarding APIs for an apocalypse.
10. P&L Breakdown – Show Me the Money
| Year | Sales | EBITDA | PAT | EPS |
|---|---|---|---|---|
| FY22 | 1,141 | 202 | 61 | 6.99 |
| FY23 | 1,046 | 99 | -31 | -3.75 |
| FY24 | 1,146 | 239 | 32 | 3.67 |
| FY25 | 1,286 | 316 | 78 | 8.01 |
Despite a strong FY25, PAT margin is still just 6%. The depreciation and interest monster is real.
11. Peer Comparison
| Company | M.Cap (Cr) | ROCE | PAT Margin | OPM | P/E |
|---|---|---|---|---|---|
| Sun Pharma | 4,06,000 | 20% | 18% | 29% | 35 |
| Cipla | 1,19,000 | 22% | 18% | 26% | 23 |
| Zydus Lifesciences | 98,000 | 24% | 20% | 30% | 21 |
| Shilpa Medicare | 8,955 | 8% | 6% | 25% | 100 |
Shilpa is like the nerd who hangs with toppers but hasn’t cracked a test yet.
12. Miscellaneous – Shareholding, Promoters
| Category | Jun 2025 |
|---|---|
| Promoters | 44.23% |
| FIIs | 11.20% |
| DIIs | 7.46% |
| Public | 37.11% |
Trends:
- Promoter stake dropped from 50.01% (2022) to 44.23% (2025)
- FIIs making a slow comeback
- Over 48,000 public shareholders—retail interest rising
Also, EIRs from USFDA and EU GMP stamps are piling up like boy scout badges.
13. EduInvesting Verdict™
Shilpa Medicare is a “potential turnaround play” disguised as a fully formed company. Here’s what makes it a spicy pick:
Green Flags:
- Global certifications? Check.
- Niche oncology focus? Check.
- OPM revival? Yes.
Red Flags:
- ROCE still under 10% after 30+ years?
- Promoter exit = mild nerves
- High CWIP = big promises
FV Range: ₹750–₹1,000. CMP ₹916 = cautiously priced
Execution will determine if this becomes the next Divi’s or just another pharma sidekick stuck in API-land.
Metadata
– Written by EduInvesting Research | 19 July 2025
– Tags: Shilpa Medicare, Oncology Pharma, API Stocks, Pharma Analysis, Turnaround Bets, USFDA Certified


