1. At a Glance
With an ROCE of 22%, debt-free status, and a stock that once touched ₹11,500, Cera is the silent warrior of India’s bathroom revolution. But has the brand maxed out its premium mojo, or is there more ceramic gold under that glaze?
2. Introduction with Hook
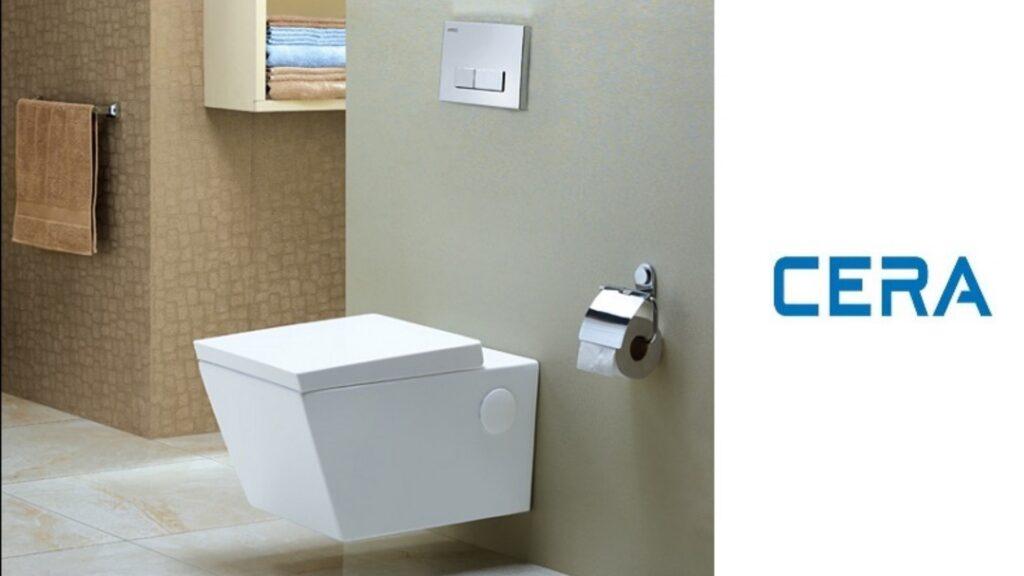
Imagine walking into a luxurious 5-star hotel bathroom. Chrome-finished faucets, elegant tiles, mood lighting, and there it is—your throne: a pristine CERA toilet. You sit down and suddenly… boom, you own the stock.
- Current Price: ₹6,922 (down ~40% from its all-time high)
- FY25 PAT: ₹246 Cr (up 4x from FY14 levels)
- Dividend Payout: 34%, clean cash flows, almost no debt
Yet, in FY25, topline grew just 2%. Is this a pause or the start of porcelain fatigue?
3. Business Model (WTF Do They Even Do?)
Cera manufactures and trades building products—mostly sanitaryware, faucets, tiles, wellness (bathtubs, shower panels), kitchen sinks, mirrors.
It operates across three major brands:
- CERA: Core value and volume-driven
- Senator: Premium sanitaryware, faucetware
- CERA Luxe: Luxury bath space targeting high-end consumers
It sells through a pan-India dealer network of 16,000+ retailers and also exports to 40+ countries. Bonus: It runs wind and solar plants in Gujarat for captive power.
4. Financials Overview
Profit & Loss Snapshot (₹ Cr):
| FY | Sales | Net Profit | OPM | ROE | EPS (₹) |
|---|---|---|---|---|---|
| FY20 | 1,209 | 116 | 14% | 19% | 89 |
| FY22 | 1,442 | 149 | 15% | 19% | 115 |
| FY24 | 1,871 | 239 | 16% | 18% | 184 |
| FY25 | 1,915 | 246 | 15% | 18% | 190 |
Key Trends:
- Sales CAGR (10Y): 9%
- PAT CAGR (10Y): 14%
- ROCE consistently >20%
- Operating margins steady around 15%
But FY25 growth was muted. Base effect? Or sector-wide slowdown?
5. Valuation
Fair Value (FV) Range:
- P/E-Based: 30x–38x FY26E EPS of ₹210 = ₹6,300 to ₹7,980
- DCF-based conservative range: ₹6,000–₹7,200
- EV/EBITDA Range: 18x–20x FY26E EBITDA = ₹6,800–₹8,000
EduInvesting Verdict™ FV Range:
₹6,300–₹8,000
Current price of ₹6,922 sits right in the mid-range, but lacks momentum catalysts.
6. What’s Cooking – News, Triggers, Drama
- Buyback Bonanza: August 2024—buyback of 1,08,333 shares at ₹12,000/share = ~₹130 Cr deployed.
- Leadership Shuffle: Multiple resignations in 2024 (Executive & Independent Directors). Execution risk?
- ESOP 2024 Launch: Aligns key management with shareholder value.
- Capex Watch: No major asset additions since FY24—flat fixed assets.
Where’s the next growth lever?
7. Balance Sheet
Balance Sheet FY25 (₹ Cr):
| Particulars | FY25 |
|---|---|
| Equity Capital | 6 |
| Reserves | 1,344 |
| Borrowings | 63 |
| Total Liabilities | 1,841 |
| Fixed Assets | 380 |
| Investments | 702 |
| Other Assets | 749 |
Key Points:
- Net debt < ₹0
- 38% of balance sheet in investments = safety cushion
- Book value per share = ₹1,038
8. Cash Flow – Sab Number Game Hai
| Year | CFO | CFI | CFF | Net Flow |
|---|---|---|---|---|
| FY22 | 98 | -70 | -21 | +7 |
| FY23 | 156 | -101 | -59 | -3 |
| FY24 | 228 | -140 | -80 | +8 |
| FY25 | 116 | +128 | -258 | -14 |
Takeaways:
- Operating cash remains strong, ~10–12% of revenue
- FY25 CFI inflow due to liquidation of investments
- FY25 CFF outflow due to aggressive buyback
9. Ratios – Sexy or Stressy?
| Ratio | FY25 |
|---|---|
| ROCE | 22% |
| ROE | 18% |
| OPM | 15% |
| P/E | 36.5 |
| D/E | ~0 |
| Cash Conversion | 137 Days |
TL;DR:
Sexy margins, zero debt, but CCC creeping up. Inventory days high at 163.
10. P&L Breakdown – Show Me the Money
| Year | Sales | EBITDA | PAT | EPS |
|---|---|---|---|---|
| FY22 | 1,442 | 221 | 149 | 115 |
| FY23 | 1,803 | 293 | 210 | 161 |
| FY24 | 1,871 | 295 | 239 | 184 |
| FY25 | 1,915 | 293 | 246 | 190 |
Margins are mature. Any PAT growth now comes from cost control or scale.
11. Peer Comparison
| Company | CMP (₹) | M.Cap (Cr) | P/E | OPM | ROCE | PAT Growth |
|---|---|---|---|---|---|---|
| Cera | 6,922 | 9,002 | 36 | 15% | 22% | 3% YoY |
| Hindware Home | 271 | 2,267 | — | 5% | 3% | Loss YoY |
| Ganga Bath Fit | 30.4 | 68 | 19 | 25% | 28% | Low base |
Verdict: Cera is the only consistent performer in the space.
12. Miscellaneous – Shareholding, Promoters
| Shareholder Type | Mar 2025 |
|---|---|
| Promoters | 54.41% |
| FIIs | 20.58% |
| DIIs | 6.93% |
| Public | 18.06% |
- FII holding rose from 18% (2023) to 22.89% (Sep 2024), now down to 20.58%
- Public shareholding increasing = retail entering
- Buyback & ESOPs indicate confidence, but execution risk post resignations
13. EduInvesting Verdict™
Cera Sanitaryware is the HDFC Bank of Bathrooms—steady, boring, cash-spewing, and elite in brand positioning. But FY25’s growth slowdown raises one smelly question:
Has growth clogged the pipeline?
The business fundamentals remain squeaky clean:
- No debt
- 22% ROCE
- 34% dividend payout
- Globally diversified base
- OPMs stable for over a decade
But premium valuations demand premium growth—which Cera didn’t deliver in FY25.
Expectations for FY26:
- A rebound to ₹2,100–2,200 Cr revenue
- EPS > ₹210
- Valuation re-rating if demand picks up in real estate or infra push from GOI
Until then, investors may enjoy the dividends while watching tiles dry.
Metadata
– Written by EduInvesting Research | 19 July 2025
– Tags: Cera Sanitaryware, Bathware Stocks, Consumer Durables, Fundamental Analysis, ROCE Kings, Buyback Stocks


